AI and climate: On the “bleeding edge” with a pioneering researcher
By Lucien Crowder | February 13, 2018
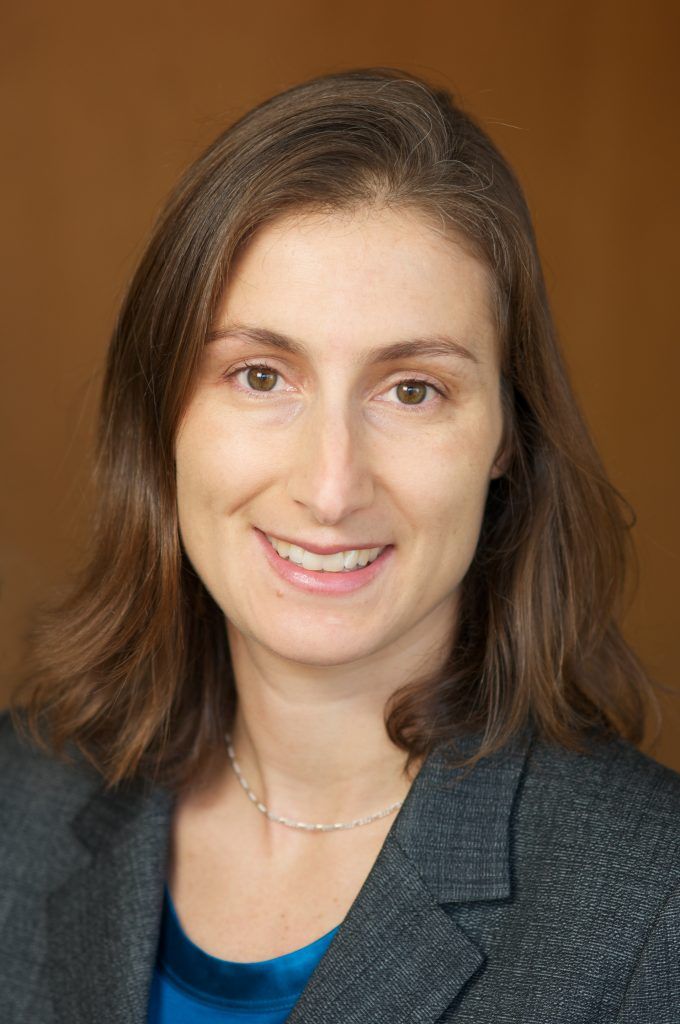
If you haven’t heard of climate informatics, maybe that’s because the field hasn’t existed for very long. It’s so new, in fact, that we can say who named it: Claire Monteleoni, a fellow at the University of Paris-Saclay and an associate professor of computer science at George Washington University.
In 2012, Monteleoni and a number of co-authors wrote a paper introducing climate informatics as a discipline. “[W]ith an ever-growing supply of climate data from satellites and environmental sensors,” they wrote, “the magnitude of data and climate model output is beginning to overwhelm the relatively simple tools currently used to analyze them.” The solution? Climate informatics—or “collaborations between climate scientists and machine learning researchers in order to bridge [the] gap between data and understanding.”
Monteleoni recently checked in with the Bulletin to discuss exactly what her discipline is, what it has achieved so far, and what must be done to ensure that AI “serves the needs of everybody.”
LUCIEN CROWDER: You work at the intersection of climate science and artificial intelligence, and those are both fairly complex disciplines. How did you end up as someone who combines them?
CLAIRE MONTELEONI: I had been very interested in environmental issues coming into college and I thought I might become an environmental scientist or an environmental lawyer. At the time, there was a lot of uncertainty around climate change, and there were sort of two lines of attack that I was told about by mentors. A lot of measurement had to be done—[American chemist and oceanographer Charles] Keeling is famous for collecting a CO2 record. And then there was a lot of climate modeling happening, and to do that one had to understand how to program computers. So I took introductory computer science courses and really just got fascinated by the math behind computer science—logic, recursion, et cetera. I was also interested in the mind, cognition, and AI, so I ended up switching. I did graduate in Earth and Planetary Sciences, with a focus on Geophysics of Atmospheres and Oceans, but I was in the process of switching over to computer science. I did exclusively computer science for the next many years, focusing on machine learning, big data analytics, and AI.
Then, around 2008, I wanted to add an application area. Most people in my field work on algorithms and also on applications. A lot of the applications that I had heard of were speech recognition, natural language processing, computer vision, and industrial applications of those. But I had also heard about machine learning being applied to scientific problems. The most notable was the success of bioinformatics, which I had heard about since my grad school days. So I came up with the idea of climate informatics because climate science and climate change had always been really important to me, and I realized I could maybe come full circle.
Then I was looking for a collaborator—and [climatologist] Gavin Schmidt, who runs the NASA center in New York City, was looking for a computer science collaborator. I was at Columbia at the time and so he was my first climate science collaborator.
CROWDER: It sounds like you are definitely one of the pioneers in the field.
MONTELEONI: Thanks, yeah. I coined the term, and I had been writing research statements, forward-looking research statements, about wanting to do climate informatics, as you do when you apply for jobs. In academic jobs, you have to talk about what your next five or 10 years of research are going to look like. So I was writing about climate informatics before I had even done a climate science collaboration.
I also really would like to credit the vision of David Waltz, who was the late head of the Center for Computational Learning Systems at Columbia University. First off, he hired me on the premise of both my past algorithmic work and my proposed future applications of AI to the study of climate change. And he really was able to see way into the future with this. He said, “We would like to empower you to build up a climate informatics research group and hire in this area.” When I decided I wanted to run a workshop on climate informatics, he was 100 percent behind that, and our annual climate informatics workshop is turning eight years old this year. You know, I was very junior, and right out of post-doc you don’t usually try to found a whole new field. I also think he was really supportive of the careers of women in computer science. A lot of other people have said that they found he was very supportive of their careers, and so I do credit him. It takes a senior, powerful person to recognize that there’s a good idea. Another senior, powerful person that recognized that it was a good idea was Gavin Schmidt. He knew he was looking for a computer science collaboration for a range of problems, but I think I really sold him on the data analytics aspect.
CROWDER: Thanks. Now, a very broad question about your field. In laypeople’s terms, what is climate informatics—and what can it do that can’t be done without machine learning techniques?
MONTELEONI: We are still in the early days of a new field with many, many possibilities, so we try to define it as broadly as possible. Basically, climate informatics refers to innovation at the intersection of data science and climate science. Climate science has a lot of different areas. There’s climate modeling. Atmospheric chemistry is a really important field that informs climate science. There’s paleoclimatology, or reconstruction of past climates using tree rings and other proxy data. These are all areas of climate science, and we want to bring them in with open arms. And the types of data scientists that historically have been attending the workshop are computer scientists—people with training in machine learning, data mining, and artificial intelligence—along with researchers coming from statistics and applied math. There’s been a whole field of statistical climatology for a long time, and so often at top climate institutes, you had people with training in statistics that were embedded, and really became domain experts in climate science.
There are also some broader interpretations of the term “climate informatics.” If you go to the American Geophysical Union’s fall meeting—the biggest meeting on Earth and space science in the world, [which] has over 20,000 attendees—there, you’ll find the words “informatics,” “geoinformatics,” and other uses of the term to apply to basically everything computer science–related. There are systems aspects, software aspects, storage, communication—which are all very important. Even if we are just talking about analytics, systems issues also come in to play in enabling large-scale analytics.
CROWDER: When you say “systems,” what…
MONTELEONI: A computer system—operating systems, and even hardware issues. Chips now have been customized to facilitate large-scale machine learning and deep learning applications. If we really want to do data analysis at scale, it’s not just the design of algorithms that comes into play, but computer software systems, operating systems, all the way down to hardware.
I [also] wanted to mention a recent milestone for the success of climate informatics. Last year the University of Toronto announced a faculty position in Sustainability and Climate Informatics. I remember the early days when I was in grad school when bioinformatics was gaining success, melding machine learning with various fields of biology. It was sort of a turning point, and now most computer science departments have bioinformatics faculty. It seems to be starting to happen in our field as well.
CROWDER: Okay, got it. Now, what would you say are the big insights that your field has yielded so far—or to reiterate a part of my previous question, what can you do with climate informatics that you couldn’t do without it?
MONTELEONI: Okay, so there have been new discoveries, and there have also been data-driven findings that turn out to corroborate findings coming out of climate science. As an example of the latter, a colleague of mine at Colorado State University, Imme Ebert-Uphoff, works on Bayesian graphical models. These are models learned from data that are quite interpretable because they show dependencies between variables. Now, you can never prove that a statistical dependence is causal, but there’s a way to disprove that a link is causal. So you can learn a complete graph—basically assume [that] all variables are dependent—and then iteratively remove edges that you can disqualify as not being causal. So [using these methods, Ebert-Uphoff and her colleagues found] that storm tracks are moving northward in the northern hemisphere. It turns out these kinds of results had also been observed using methods from the fields of meteorology [and so forth]. But this work was completely data-driven—a model completely learned from data, that when you learned it over time, you explicitly saw these tracks moving northward. So that’s a corroboration of past work.
An example of something that both corroborates past work and also contains new discoveries was some work on mega droughts, which are droughts that are large in both time and spatial scale, by Arindam Banerjee and others at the University of Minnesota. The output of their completely data-driven technique was to show mega droughts throughout history, and a variety of them were corroborated with past research. They also uncovered a lot of new ones that merit further study. Often sociological concerns or history govern what regions of the world, or what time periods, are studied. But when you can massively process data at scale, you can study things in a more dispassionate way and find other trends.
CROWDER: They identified mega droughts in the past that no one knew had happened?
MONTELEONI: Well, that had not ever been identified before in the literature. Again, that could just be for historical reasons. What’s the point? Well, the idea is that this tool can then be used predictively for drought.
CROWDER: Got it, got it.
MONTELEONI: Another paper from the University of Minnesota, Vipin Kumar’s group, discovered a new dipole. Do you know what a dipole is?
CROWDER: I do not.
MONTELEONI: It’s also called a teleconnection. Basically, it’s two locations in the world that are geographically quite separate from one another, but if you plot the time series of, say, the pressure at sea level, they are almost perfectly anti-correlated.
CROWDER: High pressure in one place, low in the other?
MONTELEONI: Right. And this sort of phenomenon exists for El Niño–Southern Oscillation, so [you might compare] a place in Brazil to a place way across the Pacific Ocean. Most of these [dipoles] are well studied, and correlate to really important weather phenomena that we observe, but this team in Minnesota—using completely data-driven techniques—found one that no one had studied in meteorology, so now meteorologists are looking into it.
Finally, another area—and one that I work on—is trying to improve predictions. I typically work with climate modelers, [such as] Gavin Schmidt, [who] runs the NASA climate model. I used the word “model” earlier in the conversation to talk about something that we, as machine learners or statisticians, learn from data, but in this case I’m talking about a mathematical model. This is a model based on scientific first principles—a physics-driven simulation. To really model the whole climate is a large endeavor, [which] was first started in the late sixties at Princeton. Princeton still has a climate modeling lab, but now there are modeling labs throughout the world—Max Planck in Germany, Australia has a model, NASA has a model, the [United Kingdom] has a model, et cetera. So each of these is a huge laboratory, which has been working for 30 or 40 years to implement software simulations of the climate system [typically in Fortran]. So you can set initial conditions, run simulations, and then check temperatures, or humidities, or cloud cover in various locations in the future. And under the hood, they’re modeling four major systems: atmosphere, ocean, land, and cryosphere, which is ice.
And then there are the individual components—for example, heat causing evaporation of water from the ocean or land, or different atmospheric gases having reactions in the atmosphere, or water condensing around aerosol particles to form clouds. Those are examples of component processes, and each component is thought to be very well understood, so you can just write down a mathematical model. Typically, these are done using nonstochastic partial differential equations. Because scientific first principles are being used here, I had originally asked climate scientists if they wanted machine learning to improve our estimation from data of the reaction rates in each of these differential equations that are modeling physical processes. They said “No, these are as well understood as gravity.”
But why do these climate models make widely different predictions from one another? I think it has a lot to do with choices that have been made in doing discretizations. [The models use cubes that discretize the globe into grid cells], and while sometimes the vertical is discretized by height, sometimes it’s discretized based on level sets of pressure, for example. That’s done differently in different laboratories.
Another issue is how you couple the processes and systems. The coupling of the atmosphere and ocean—at what height in the atmosphere do you model that coupling? And also, generally speaking, there are computationally very hard issues that have to do with differences in scale. On time scales, the atmosphere circulates on the order of a few weeks, but the ocean circulates on the order of hundreds of years. So they’re massively different in terms of the time scales that are concerned with atmospheric versus ocean phenomena. And then also on spatial scales—the resolution to understand clouds is very, very high-resolution. You have to look at really small spatial scales.
Anyway, these are some ways to get a handle on why the climate models might differ, and in our work we actually didn’t look under the hood of the climate models at all. We just treated them as black boxes that are going to output a sequence of predictions. Even if we just look at temperature—averaged monthly or even annually, either at particular locations or averaged globally—you get time series of temperatures, one from each climate model. And we used AI to intelligently combine the ensemble of predictions. In my algorithmic past life, I had been working on these portfolio management algorithms that are often thought about in finance, but really, you can have an ensemble of any kind of predictors, and you’re trying to adaptively and intelligently make a combined prediction.
So the standard practice in climate science, in reports from the Intergovernmental Panel on Climate Change (IPCC), was to show the whole ensemble spread of predictions, so you’d kind of have this cloud of lines from all the different labs, and then show the average. An average assumes that you have equal belief that all the models are good. But if you change the game slightly, where after each prediction time interval, you get to see the observation… . Say all the models make a prediction of global average temperature at the beginning of January. Well, at the end of the month, you’ve measured the real temperature, and so you can tell which models are currently performing well or poorly, with respect to how well their predictions match the observation.
Say you started with equal weights. You could then increase the weights on the models that were performing well and decrease the weights on those performing poorly and now predict with a weighted average, for example. The special sauce comes with which algorithm we should use to do this. I had previously been specifically working on how we do machine learning when the concept that we’re trying to learn can actually change over time. I was motivated by problems in cognitive science—how humans can learn and how we learn in the face of uncertainty. Finance is a good example, because the market is not very predictable. It turns out that in climate, we’re also learning something similar. Now that there’s climate change, we’re learning patterns that may change over time—i.e., how do you play a game when the rules are always changing?
I had worked on algorithms for the more general setting, which includes problems in finance, and so we applied one of my past algorithms to this problem of, “Can we predict better than just using a uniform average of the IPCC ensemble?” And we did. So how did we validate this? We validated it on historical data. Then we also validated it on future simulations using a technique suggested by my climate science collaborator, Gavin Schmidt. There’s a validation technique used in climate science, if you want to validate future predictions—in climate science, those are called “projections”—you’ll pretend that one of the climate models is correct. Say, pretend that the model from Max Planck is the truth. So we now just train from the remaining models in the ensemble and see how well we can predict the Max Planck model. Then we repeat this experiment, where we pretend the model from NASA was the truth, and so we remove that from our training ensemble and we try to predict it. [And so on and so forth, holding out a different model each time.] Our algorithm actually did really well in that context as well, because even if there was another model in the ensemble that was pretty good at matching the model that we were pretending was the future, the identity of the other best model cannot be known beforehand, so our algorithm was adaptively learning that.
The key idea behind this work is the level of non-stationarity, or the level of change in the environment, or burstiness—we are learning that from the data as well, simultaneously with trying to make adaptive predictions from the ensemble of climate models. So this was more of an algorithmic proof of concept, but Gavin—who’s an IPCC member, one of the scientists whose models inform the IPCC—took this to an IPCC expert meeting, and there was interest.
So we launched the first climate informatics workshop shortly after that. Although some collaborations between machine learning and data mining researchers and climate scientists existed prior to 2011, the workshop played a critical role in creating a new interdisciplinary research community, united around a new name and an annual event. Our work also won a Best Paper Award at a NASA conference on data analytics for NASA applications such as Earth science. Since then, what we’ve done is look at, “What if what you’re trying to learn changes not only over time, but also over location?” My student Scott McQuade did his Ph.D. dissertation on developing machine learning algorithms that make geographically explicit predictions on scales at which the climate models already predict. We can apply our AI in a geographically explicit way, which discovers and exploits local structure in both space and time.
CROWDER: This might be kind of a naïve question, but in your evaluation of the various climate models, did you get any indication of whether we should be less or more pessimistic about climate change? That is, did more pessimistic models do better, or was it the other way around?
MONTELEONI: I don’t have conclusions on that. What I’m trying to output is methodology and… . I think the value of climate informatics will be when we can shed light on good methodology for improving predictions, so I personally have steered clear of making predictions myself. We have some results that show which climate models are better under which conditions, and could potentially be used for that, but so far we haven’t really highlighted that in what we’re trying to output to climate scientists. We’re trying to give them tools that they can use to make predictions.
CROWDER: Okay. Fair enough. Could you use climate informatics, or something like it, to model the effects of say, carbon removal schemes, or other kinds of geoengineering projects?
MONTELEONI: Certainly. I think so. But there has to be some source of ground truth data. Machine learning methods are not magic—“garbage in, garbage out.” If we have some ground truth data, where we have input/output pairs of the features of interest and then the relevant output—and we have a lot of them—then certainly we can make predictions for any such problem.
I will say, even without machine learning, the climate modeling endeavor has led to some very interesting conclusions. The IPCC was awarded the Nobel Peace Prize in 2007, shared with Al Gore, and it’s a big body of scientists, and a lot of their predictions are the result of these climate model simulations. One of the canonical plots just looks at a measure of historical temperature up until the present, where you have a jagged increase in temperature in the recent past. Climate models also allow you to simulate forcings. To define forcings, consider the simulations of atmosphere and ocean, land and ice, interacting as usual—but then you can inject something into the simulation, i.e., you can simulate a volcano erupting, which adds gasses and certain additional aerosol particles, and changes a variety of aspects of the climate system.
You can also simulate the burning of fossil fuel and the change in atmospheric gas composition. The models were run without this forcing, and the entire ensemble and the ensemble mean ended up at a much cooler temperature than has been observed in the past 20 or 30 years. The only way to get the multi-model mean to pretty well match observed temperatures was to inject a forcing of anthropogenic-generated fossil fuel usage. The Department of Energy funds a lot of the climate modeling research, and they’re interested in various possible energy futures, which will help inform how to invest in various technologies.
The models have now been augmented so that there are Earth system models that also include things like agriculture and land use and various sorts of human input. The point is that these physics-driven models can be run under a variety of scenarios. Yet, given these simulations, I think you raise a really interesting point [about the potential ability of climate informatics to model geoengineering schemes]. It would be very interesting to see what we could discover using machine learning.
I mentioned earlier that you would need ground-truth labeled data. That’s for the whole field of “supervised learning” in which one wants to do prediction—but there’s also a very rich and interesting field called “unsupervised learning,” that I also work in, which enables you to find saliency and hidden structure in the data, or to find clusters in the data that are similar, which can be used for exploratory data analysis. It can also be used in the first step of a machine learning pipeline, where you’re going to learn a predictor in the second step.
I can give an example of what we’ve done in unsupervised learning in climate. Extremes are important, e.g., these mega storms that we’ve been having, and hurricanes, and what seem to be anomalously cold events and anomalously hot events. If we have an increasing average temperature, we might expect the prevalence of extreme hot events to increase and the prevalence of extreme cold events to decrease. But that’s just looking at how the average changes, without thinking about the variance. Even if the average temperature were not increasing, if the variance of temperature were increasing then we would have an increasing probability of both hot events and cold events. So there’s a lot of uncertainty as to whether that’s happening. There are even scenarios where we could have both a mean shift and an increase in variance, and additionally a change in the shape of the temperature distribution, such that cold events could occur with similar probabilities to what they had been in the past and warm events would be more likely, for example.
There’s uncertainty there. The World Climate Research Programme, an international group of climate scientists, puts out grand challenge problems, and two of the big ones published in 2013 [involved] understanding what’s happening in the extremes—extreme hot, extreme cold and resulting storms, droughts, et cetera. And also being able to study things more at regional scales. Because when you average, you reduce variance—[but a] 2-degree Celsius global change could correspond with much larger changes at any particular local region.
We were interested in studying the effects of climate change on extreme events. My PhD student, Cheng Tang, wanted to get a handle on extreme events, so she looked at a report put out by the IPCC about extremes, and found several different definitions. She was trying to formalize it mathematically, but one way of viewing extremes is when a certain variable like temperature goes over a certain threshold, then it’s extreme. Of course, this definition leaves something to be desired, because we would like to think about levels, different levels of temperature. Also, when we think of something like a heat wave, we want to think about multiple variables. High temperature, high pressure. Very low humidity, low precipitable water. There, I’ve just mentioned four different climatic variables, so it doesn’t make sense to just threshold variables individually.
Tang also found things in other parts of the climate literature—indices that were designed to detect a specific type of extreme. [For example], there’s something called the Palmer Drought Severity Index, which can detect droughts. We were wondering if we could have a technique that could detect multiple sorts of extreme events, and so we did a proof of concept using unsupervised learning, a subfield of machine learning. We could, just from the data, learn data-driven definitions of extremes.
There’s a family of techniques called topic modeling that [was] originally designed to understand text data, [but] has since been mapped over to vision and video data. But the math can also be mapped over to just real-valued data, climatological data. And when you extract topics, topics now are probability distributions over climatic observations, and so we can sort of just apply this technique and then look at the resulting climate topics, if you will.
Some of them were just, “Everything is in its average usual state”—average temperature for the region, average humidity, et cetera. But we did find some topics that corresponded to extreme events that were learned wholly in this data-driven way. Something heatwave-like with very high pressure, high temperature, low humidity, low precipitable water. And something very much corresponding to a wet event with low pressure, high humidity, et cetera.
So this was now a multivariate and flexible and completely data-driven definition of an extreme. We had nothing in the climate literature we could compare to, so we did a qualitative validation where we would map the prevalence of the climate topic (that we had learned from the data) that corresponded to heat waves, to see if we could recover known major droughts in the past, and that worked.
This shows that even these unsupervised techniques coming out of machine learning can shed light on these definitional problems that could potentially be needed in the study of climate change.
CROWDER: Let me ask one final question. There’s still a good deal of uncertainty in climate science and about the way climate change will unfold in the future. Ultimately, how much potential do you think climate informatics has for reducing that uncertainty? In 10 years or 20 years, will we be able to state with some certainty what the climate will be like at a certain point in the future—assuming variables X, Y, and Z?
MONTELEONI: I like your desire to put me on the spot with metrics. I’m not going to be able to, off the top of my head, predict some metrics. But I do think the following. We know analytics has been a game changer, certainly in the private sector. Look at web search, targeted ads, [and so on]. It’s changed many people’s lives. We also know that there’s massive amounts of climate data, and that the simulated data generated by climate models encodes a lot of physics and also scientific knowledge. There’s so much simulation data. I heard from a climate modeler that the amount of simulation output stored actually dwarfs all the satellite image retrieval that is currently stored, which is pretty impressive.
So data analytics is a bleeding-edge, successful technology—and in some sense, it’s a very cheap way to unlock the insights lying in the reams of climate-model simulation output and observation data that we have. Some of it hasn’t even been analyzed, and to analyze it in an automated, large-scale way is definitely worth doing. I think the cheapest way to do it is to [use] automated algorithms that can learn.
I do have a vision that AI is going to be able to shed light on climate change, and we’ve already seen several recent successes. The World Economic Forum has now recognized climate informatics as an official key priority. At the American Geophysical Union fall meeting, there has been a proliferation—even just looking at last year alone—in the number of sessions and posters with AI or machine learning or deep learning or climate informatics in the title. So it may take a while for us to see the end results, but these methods—and the access to the data scientists that are up to date with the bleeding-edge methods—are starting to be disseminated. This has been an experiment in building a new interdisciplinary field. I don’t want to risk making any specific prediction, but I do think our efforts with AI will help in this direction.
I’ll end by talking about ethics in AI. I know the Bulletin recently published an interview with [Berkeley computer science professor] Stuart Russell, and I am so grateful that he and others are forming panels and societies to address the ethical issues and the potential dark sides of AI—that has to happen. Legislation has to happen. But in addition to climate informatics, there’s a larger community of computational sustainability. There’s also a movement called AI for Social Good. I have a colleague, Rayid Ghani, pushing that. There’s a whole community, and together, we are saying, “Look, AI can also be used to solve grand challenges and to drastically accelerate discovery in scientific fields that can help society.”
So, defining AI ethics to avoid the dangers of AI is something that I’m really glad people are looking at. The endeavor of green AI, AI for Social Good, and climate informatics is to apply AI to problems with social benefit. I’ll also mention there are great efforts in AI for education, AI in the developing world, AI in health care, AI in personalized medicine. These are all positive things that AI can be used for.
Then finally, myself and others have been working to broaden participation in AI. I’m an advisory member of the workshop for Women in Machine Learning, which has also become a strong community. We maintain a database of women in AI to make sure that there’s always enough representation on various panels and conferences, and to make sure women are included in the AI endeavor. We’re very supportive and glad to see a workshop that started this year called Black in AI, which was very inclusive and had a global attendance. Both of these endeavors are growing, and are going to be very important, positive expansions to make sure AI serves the needs of everybody.
Together, we make the world safer.
The Bulletin elevates expert voices above the noise. But as an independent nonprofit organization, our operations depend on the support of readers like you. Help us continue to deliver quality journalism that holds leaders accountable. Your support of our work at any level is important. In return, we promise our coverage will be understandable, influential, vigilant, solution-oriented, and fair-minded. Together we can make a difference.
Keywords: women
Topics: Analysis, Climate Change


