Extreme climate change science, from the ground up
By Kelly Brunt | December 20, 2018
 Image credit: NASA's Goddard Space Flight Center
Editor’s note: At publication time, the author was beginning the first leg of the Antarctic research journey detailed below. The traverse is expected to take 2–3 weeks.
Our polar regions are changing. Grounded ice is melting off of both Greenland and Antarctica, contributing directly to changes in mean sea level. Arctic sea ice is shrinking, altering the heat flux between ocean and atmosphere and driving extreme weather patterns.
Given the importance of understanding these changes and their impact on society, the National Aeronatics and Space Administration (NASA) recently launched a new tool to obtain the most precise measurements yet of ice elevation in the polar regions—down to the width of a pencil. Far above the quiet expanse of the world’s least travelled continent, some of the most advanced scientific instruments ever built are staring down to get a better look.
Measuring a centimeter from 500 kilometers away. NASA’s ICESat-2 (Ice, Cloud, and land Elevation Satellite 2) was successfully placed into orbit at 6:02 AM on September 15, from Vandenberg Air Force Base in California. The early morning launch was a dazzling display, with the payload carried to space on the venerable Delta II rocket’s final flight.
Ice sheet scientists have measured changes in Greenland and Antarctica using various datasets, including some derived from NASA’s ICESat, GRACE (Gravity Recovery and Climate Experiment), and Operation IceBridge satellite and airborne missions. Each of these efforts represents different technologies, or suites of technologies, all providing polar measurements that tell a similar story: Land-based Ice sheets are losing mass around the coasts, and that ice is going into the ocean, raising sea levels. But a longer time series of data is needed to help scientists determine the rate of change—not just how much ice is going from land into the oceans, but also how quickly.
Focused on changes in the polar regions, ICESat-2 joins a fleet of NASA Earth science satellites making complementary measurements. A group of scientists throughout the United States is analyzing preliminary elevation data measured during the first three months ICESat-2 has been in orbit. The satellite will eventually collect extremely detailed data on elevations across the entire planet, but it has two specific measurement goals that focus on polar ice.
The first ice-specific goal is to measure sub-centimeter-scale changes in the height of ice sheets, which are continent-scale masses of glacial ice limited to the polar regions. This term only refers to Greenland and Antarctica, whose land-based glaciers together hold most of the freshwater on Earth. Combining our knowledge of the surface elevation change of these ice sheets with existing knowledge of the density structure of the glacial ice and the snow that caps it, glaciologist scan assess how changes in ice sheets contribute to mean sea level rise. Changes in sea level directly impact the large populations of people living along coasts—including, as reported in the recent National Climate Assessment, the coastal United States.
The second ice-specific goal is to measure the the floating sea ice pack. Sea ice is the frozen surface of oceans, usually limited to the polar regions. While land-based ice sheets are sourced from snow from our atmosphere, sea ice is frozen sea water that can also be capped by a layer of snow. The freeboard measurement, or measurement of the height of sea ice above the ocean surface, is calculated at the centimeter scale. Along with hydrostatic assumptions and knowledge of the density structure of the sea ice and snow that caps it, a more precise evaluation of the freeboard height will enable detailed assessment of overall changes in sea ice thickness. While changes in sea ice do not directly contribute to sea level rise, they do influence the heat and moisture exchange that occurs between the ocean and the atmosphere, especially in the Arctic. This in turn affects global weather patterns, which impacts the entire planet regardless of proximity to the coast.
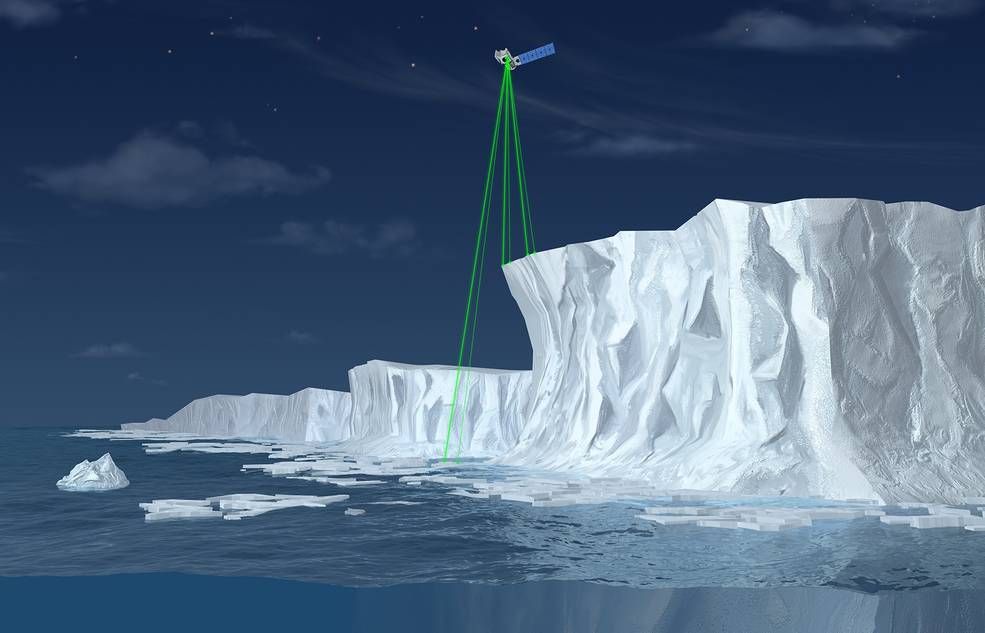
Green beams on ice. To perform both of these measurement operations, ICESat-2 carries a single instrument called ATLAS (Advanced Topographic Laser Altimeter System). ATLAS fires six laser beams at 532-nanometer (i.e. green) wavelengths 10,000 times each second. Of the 20 trillion photons emitted with each pulse, only about a dozen reach the Earth’s surface and reflect back to the satellite’s receiver telescope.Each day, ICESat-2 stores 580 gigabits of data on the round-trip travel of those pulses. Combining this with the location of the satellite and the known pointing angle of the laser, the surface elevation can then be accurately gauged.
Travelling at 4.3 miles per second, the satellite will complete a full orbit in 94 minutes. To obtain the global coverage needed to make the crucial assessment in the polar regions, the satellite has 1,387 unique orbits that travel the Earth’s entire surface once every 91 days. After repeated orbits, ICESat-2 will enable detailed comparisons of elevation assessments and provide glaciologists a sense of seasonal and annual elevation change.
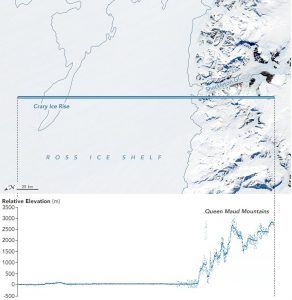
ICESat-2 is the sequel to the first ICESat satellite, which was operational between 2003 and 2009. For my post-doctoral research, I worked with ICESat data to investigate the grounding zone of the Antarctic ice sheet, where the grounded ice detaches from the underlying bedrock and goes afloat as it comes in contact with the southern ocean. These highly sensitive regions of the ice sheet act as a barometer for the overall state of the ice sheet.
Data from ICESat provides glaciologists with a phenomenal tool for ice sheet science, but ICESat-2 is a giant step forward based in part on its along-track data density. ICESat fired a laser shot once every football field and a half of the surface (about 170 m); ICESat-2 will fire a laser shot every two and a half footballs (about 70 cm). Further, ICESat was a single-beam instrument. ICESat-2 is a multibeam instrument providing greater data density.
Bridging the data gap. When data from both satellite missions are combined, ice-sheet researchers will be able to assess longer-term rates of ice sheet change. But there is a nine-year break between the operational period of ICESat (2003 to 2009) and the launch of ICESat-2. This interrupted the collection of data aimed at informing us not only about absolute ice sheet change, but also differences in the rates of change over time.
To bridge this gap between the ICESat and ICESat-2 missions, NASA initiated its largest ever airborne research campaign: Operation IceBridge. For nearly a decade, IceBridge has deployed at least twice each year, targeting dynamic regions of sea ice pack and ice sheets that have been identified as vulnerable by previous missions (including ICESat). The IceBridge instrument suite is flown at relatively low altitudes (about 1,500 feet above the surface) on various aircraft that have been modified for research capabilities. The instrument suite includes laser altimeters that provide information about the surface of the ice, similar to its satellite counterparts. But the IceBridge instrument suite also includes radars that provide information on the subsurface; this capability is currently not possible from a space platform.
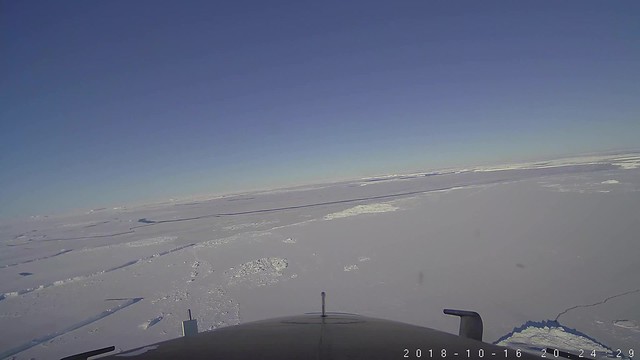
The standard spring (Arctic focus) and fall (Antarctic focus) IceBridge airborne campaigns will continue for approximately a year into the ICESat-2 mission, to overlap with the new satellite and to provide contemporaneous data that can be used to affirm the ATLAS laser altimeter data. ICESat-2 has stringent mission goals and requirements with respect to elevation accuracy and precision. While airborne campaigns can collect lots of data for direct comparison with satellite data, airborne elevation data are generally less accurate and less precise than that of ground-based campaigns. To fully understand the accuracy of ICESat-2, both airborne and ground-based elevation data are essential for satellite data validation.

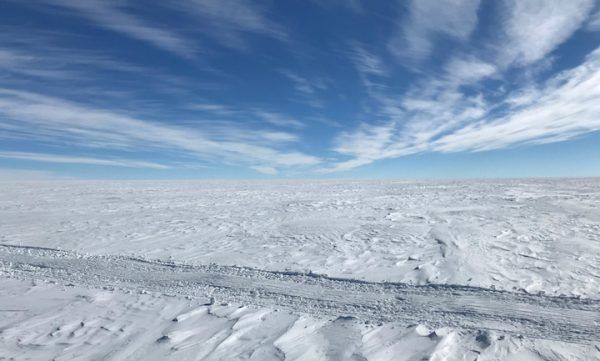
A road(less) trip across Antarctica. The ICESat-2 orbit covers almost all of the globe, reaching 88 degrees north and south of the Equator. This leaves a tiny disk at each pole where no readings can be collected by the laser. On the other hand, the orbits of ICESat-2 all converge along the 88th parallel, and consequently the data is extremely dense. This makes it a great place to assess how the satellite is performing.
To do that, I am currently leading a two-month field campaign in Antarctica with another NASA scientist, a mechanic, and an expedition mountaineer. We will collect ground-based GPS data with centimeter-level accuracy and precision (a typical car or phone has approximately meter-scale accuracy). This GPS data, which includes not only latitude and longitude but also precise elevation, will be used for direct comparison with the observations from the satellite.
The Antarctic ice sheet stretches across 14 million square kilometers. It can be difficult to cover enough ground on a scale adequate for satellite applications. The campaign is relatively large in scope, however, and will collect 300 km of data to validate ICESat-2’s results.
Referred to as the 88S Traverse, this Antarctic project is entering its second season. Last year I led the first traverse, and the data that we collected then was used to evaluate the satellite during its commissioning phase. This year the stakes are higher, as the ground-based data will be collected concurrently with data from the satellite and recent IceBridge flights that surveyed the 88S Traverse route. Tying these ground-based, airborne, and satellite observations together will provide NASA with the best assessments of how ICESat-2 is performing.

We start and end at the South Pole. To get there, you fly via commercial aircraft from the US to Christchurch, New Zealand, and then via military aircraft to finally arrive at South Pole Station. That station is in the center of the ice sheet, and therefore requires transport on aircraft equipped with skis. From the South Pole, the traverse route heads north 220 km to the 88 degrees South line of latitude. The 88S Traverse then traces the 88 degree line of latitude (the important stretch) for 300 km before turning south and heading 220 km back to the South Pole.
The traverse involves four people traveling in two large tracked vehicles (similar to the vehicles that groom ski areas), driving for about 14 days. The tracked vehicles drag 20-meter long sleds that carry all of the equipment required for both science and for “comfortable” living. This includes fuel for the vehicles, a generator to keep the vehicles warm at night, science cargo (such as spare GPS equipment), food, and camping equipment. The sleds are also designed to carry our sleeping and cooking tents fully set up, which cuts down on the time required to set camp every evening. Last season, the ambient temperature was about -20 degrees Celsius for most of the trip, and we fortunately did not experience any major wind events. While this may seem a bit cold for sleeping, I slept like a baby atop four foam pads (and inside a sleeping bag rated to -40 degrees Celsius, which was in turn inside a second down sleeping bag).
The traverse experience is just like a long road trip: You eat a lot of junk food, and you’d better like your travel companions! But unlike driving across the United States, we don’t have the luxury of roads or good maps. Instead, we drive entirely using GPS units, with a series of waypoints, or breadcrumbs, telling us where to go.
One delightful benefit: absolutely no commuter traffic.
Together, we make the world safer.
The Bulletin elevates expert voices above the noise. But as an independent nonprofit organization, our operations depend on the support of readers like you. Help us continue to deliver quality journalism that holds leaders accountable. Your support of our work at any level is important. In return, we promise our coverage will be understandable, influential, vigilant, solution-oriented, and fair-minded. Together we can make a difference.
Topics: Climate Change
Kelly Brunt
Kelly Brunt is an Associate Research Scientist with the Earth System Science Interdisciplinary Center (ESSIC) at the University of Maryland and the... Read More


A well written article that the educated layperson can use to dispute the “flat earthers” that insist that everything is just fine because it is cold out today and my basement is not flooding.