What in the world is weather whiplash?
By Jennifer A. Francis | February 9, 2024
 Snow in Texas, February 15, 2021. (Alexander Hatley/Flickr)
Temperatures across the United States this winter have been on a roller coaster.
Average December temperatures in Minnesota, for example, were 14 degrees Fahrenheit warmer than usual, but the following month, they plummeted below the 30-year average before swinging back up to break an all-time high on January 31, hitting a balmy 55 degrees—nine degrees above the previous daily record. Parts of Montana saw a 90 to 100-degree temperature swing in the span of a month.
It wasn’t just the northern states that experienced the temperature yo-yo. Frigid arctic air swept down over much of the United States. At least 55 deaths have been attributed to January’s cold and winter storms. The airport in Houston, Texas, hit an all-time low for January 16 of 19 degrees Fahrenheit. And as in Minnesota, Houston’s temperatures soon rebounded to warmer-than average.
“Weather whiplash” events like these can be costly, even deadly. While an exact definition doesn’t yet exist, weather whiplash generally connotes an abrupt shift from one set of persistent weather conditions to a very different set. Long-duration drought followed by heavy precipitation, for example, can damage crops. Orchards can be devastated by the arrival of a severe cold snap after a persistent early-spring warm spell. Prolonged summer heat waves and drought have also fueled wildland fires across Canada and Mediterranean Europe in recent years, and if these conditions shift abruptly to a stormy pattern with intense rain, barren burn scars will absorb little moisture, raising the threat of flash flooding. All of these types of whiplash have occurred multiple times in recent years, and some research suggests they may happen more often in the future.
Researchers have used various metrics to identify weather whiplash events. Some studies focus on temperature jumps while others target changes in precipitation extremes. Some metrics measure whiplash at a single location while others target a region. No matter how you measure it, weather whiplash events are often highly disruptive to agriculture, ecosystems, infrastructure, and human activities.
My research team has taken a different tack, focusing on abrupt shifts in continental-scale patterns in the jet stream—the strong river of west-to-east wind that encircles northern and southern hemispheres at altitudes where jets fly. We used an artificial-intelligence tool to identify typical jet-stream patterns consisting of north-south swings or waves that can set up in different locations across North America or Eurasia. These waves are important because they create and steer the weather systems we experience on the surface—those high- and low-pressure areas seen on TV weather maps. For example, when a northward bulge in the jet stream (called a ridge) is located over western states, dry and warm conditions generally prevail in the region as storms are steered northward into western Canada. In contrast, a large southward dip in the jet stream (a trough) allows cold Arctic air to penetrate unusually far south in winter months, leading to debilitating cold spells in southern states that are ill-equipped to deal with them.
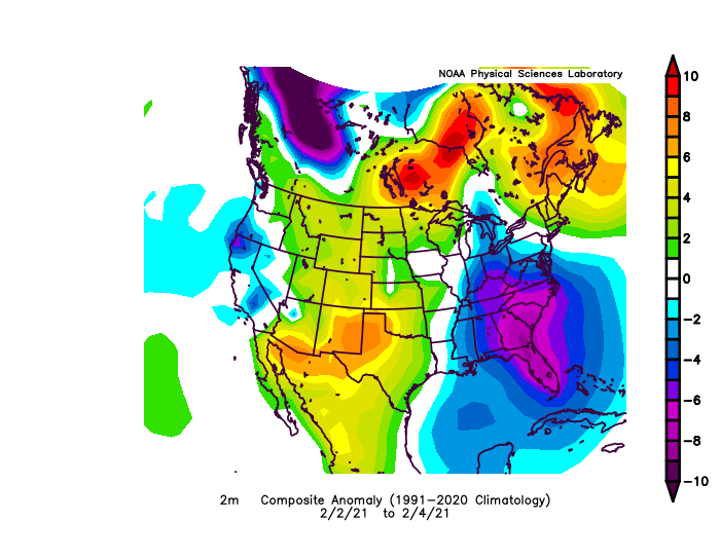
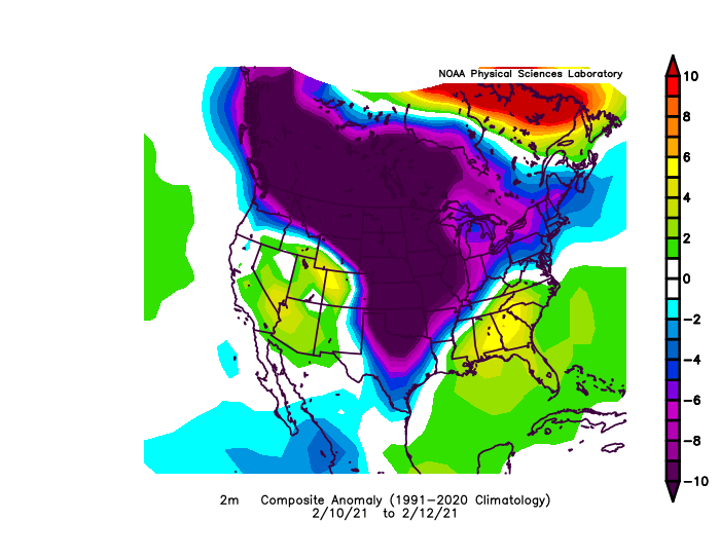
The “Texas freeze” in February 2021, which killed 246 people and cost around $200 billion, is an excellent example of a highly disruptive weather whiplash event. In early February (Figure 1), temperatures were running well above normal across much of the United States west of the Mississippi River, while in southeastern states temperatures were much cooler than usual. Only a few days later (Figure 2), a major pattern shift occurred that brought frigid Arctic air all the way down to the US-Mexico border, wreaking havoc with energy utilities that couldn’t keep up with the demand for heating, especially in Texas.
The size and location of jet-stream waves dictates weather in midlatitudes (the zone between the polar region and the tropics), so identifying and tracking their patterns tells us a lot about weather regimes and their changes over time. We identified a set of twelve typical jet-stream patterns using daily maps of the upper-level atmosphere since the late 1940s (specifically, anomalies in the height of upper-level pressure). The next step was to look for cases during which the atmosphere became “stuck” in one pattern for four or more days. When these long-duration events happen, surface weather conditions tend to be persistent—be they hot, dry, cold, or wet depending on the location of the jet stream’s ridges and troughs. We then identified which pattern the atmosphere shifted to after the jet stream became unstuck, and measured how different the new pattern was from the previous persistent one. If it was sufficiently different (statistically speaking), we counted the shift as a weather whiplash event. We tallied the events over each season and year, then tracked changes in frequency based on the pattern where they started.
Interestingly, we found that when the initial persistent pattern of the whiplash event features abnormally warm temperatures in the Pacific and Atlantic sectors of the Arctic Ocean (note the Arctic is warming three to four times faster than the globe as a whole!), weather whiplash events occurred more often in recent years. And when the Arctic is unusually cold (which is occurring less and less often), fewer whiplash events were produced. We found whiplash events have become more frequent in recent years when the Pacific and Atlantic sectors of the Arctic are abnormally warm, and less frequent when it’s colder than normal.
One beauty of this method is we can analyze both past conditions as well as those for the future based on simulations by climate models. Our research suggests that if we continue to expel greenhouse gases into the atmosphere and cut down forests as we have been doing, future changes in the frequency of weather whiplash events will exhibit similar but much stronger trends, especially in summer months. We know rapid warming in the Arctic will worsen in the future as human activities continue to augment the amount of heat-trapping gases in the atmosphere. So according to our findings, we should also expect to see weather whiplash events happen more often, along with the often devastating impacts they cause.
Together, we make the world safer.
The Bulletin elevates expert voices above the noise. But as an independent nonprofit organization, our operations depend on the support of readers like you. Help us continue to deliver quality journalism that holds leaders accountable. Your support of our work at any level is important. In return, we promise our coverage will be understandable, influential, vigilant, solution-oriented, and fair-minded. Together we can make a difference.

Jennifer A. Francis
Jennifer A. Francis is a senior scientist at the Woodwell Climate Research Center.... Read More


we geographers call this declining spatio-temporal correlation.