Why the bad news in the IPCC report is good news for visual learners
By Thomas Gaulkin | August 20, 2021

Last week the Intergovernmental Panel on Climate Change (IPCC) released the latest report in its sixth assessment cycle, “Climate Change 2021: the Physical Science Basis.” Much of the material in the report constitutes a synthesis of research that points undeniably to the human influence on the climate, from some 14,000 scientific papers published through January of this year.
Headlines generated by the release of the report emphasized the fact that climate scientists definitely stated that humans are causing the global warming that is changing the planet. Few people who follow the news—of proliferating wildfires, hurricanes, arctic ice melt, and other alarming trends—would be particularly surprised by the assessment that things are as bad as they’ve ever been and will continue to get worse even with rapid reductions of carbon and methane emissions. One footnote captures the most optimistic scenario:

Read it for the pictures
But if there was an undeniably positive reaction generated by the generally gloomy IPCC publication, it was to the improved visuals that accompanied the report’s dense 4,000 pages of text, especially the graphics found in the Summary for Policymakers (the digest of the report that actually gets read by non-scientists).
https://twitter.com/DagomarDegroot/status/1424740808566132748
In its outreach around the August 9 release of the report, the IPCC emphasized the cooperation of 234 authors from 66 countries. But one author estimated the full scientific effort involved in gathering and analyzing years of climate research may be in the tens or hundreds of thousands of experts. This included, apparently for the first time, professional designers who volunteered to create the most widely circulated data visuals in the report.
“One key development since AR5 was the involvement of professional graphic designers in creating the figures for the Summary for Policymakers,” wrote Ed Hawkins, a climate scientist and creator of the often seen warming stripes image. “As a result, the graphics are clear and usable, having been user-tested through several design iterations.”
#ClimateReport #IPCC #GIEC
How it started (left, sketch on my desk, Feb. 2020) and how it ended (right, SPM-Fig1), after hours of brainstorming @ed_hawkins, many versions & the magic touch of @angelamorelli @tomhal99 @MelichatGo @jordanharold. What a journey! Thank you all 🙏 pic.twitter.com/bqUBMNllun— Christophe Cassou (@cassouman40) August 10, 2021
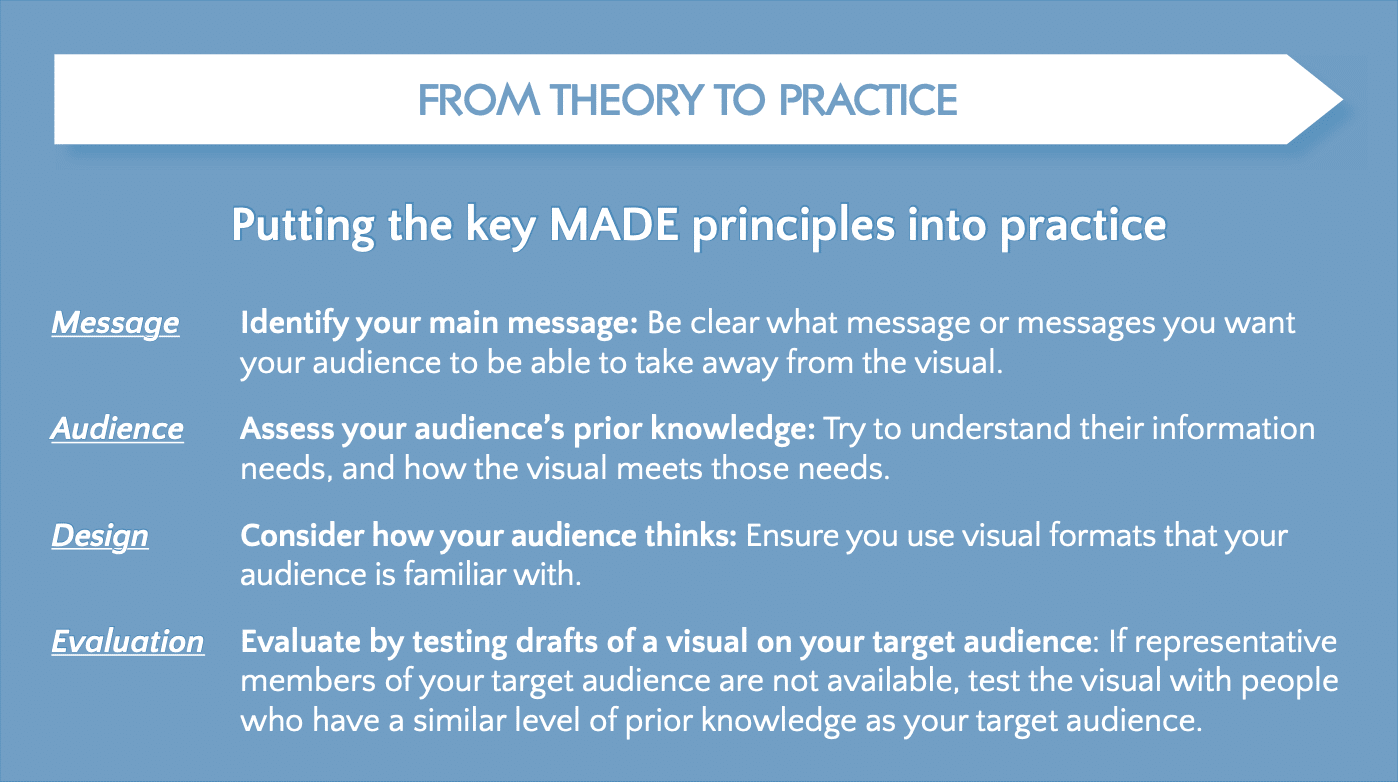
The IPCC’s own visual identity guidelines identify graphics as “the cornerstone of the information provided by the IPCC.” To create graphics that are meaningful, the organization relies heavily on studies and recommendations made by the Tyndall Center for Climate Research in 2017. The IPCC style guide suggests that wherever possible, authors should “choose a visual format that your audience is familiar with.” That is inevitably easier said than done when trying to present complex climate data.
The emphasis on visual communication is not new to climate scientists looking to inform policy-makers, voters, and other scientists. Climate modeling requires a complex integration of scientific disciplines that can be distinctly challenging to translate for non-scientists seeking firm and understandable ground to take action to avert further damage to the planet. When it comes to IPCC reports, a picture could potentially be worth closer to 1,000 pages.
Melissa Gomis, a senior science officer at the IPCC, coordinated the graphics effort, which included consultation with cognitive experts and user tests with policymakers to consolidate the main messages of the report into visual form. She told Inside Climate News that showing the report’s findings through graphics can “really help visualize…what is not perceivable out of raw data or out of your window.”
Less commonly cited accompaniments to the report are the Technical Summary and FAQ, which include dozens more graphics that in some cases are even more accessible to non-scientists than those found in the Summary for Policymakers. The IPCC also unveiled an impressive interactive atlas that uses the same modeling data underlying the report to map future regional temperature, rainfall, snowfall, and even sea level rise. The interactive received far less attention than the new graphics within the report, but may end up being its most valuable visual aid.
Even the main scientific chapters of the report—where detailed tables and charts can pose a challenge even to other scientists brave enough to read that far—featured improved graphics. Hawkins’ own warming stripes image makes several appearances deep into the reams, including on page 204 of Chapter 1:
One of my personal favourites. A figure we did in Chapter 1 of #IPCC #ClimateReport showing the five considered scenarios, the timings peaking and halving CO2 emissions as well as when they reach net-zero. Together with @ed_hawkins beautiful stripes. pic.twitter.com/B3AGuf2aq8
— Malte Meinshausen (@meinshausen) August 10, 2021
Spot the difference
Valerie Masson-Delmotte, co-chair of the Working Group that produced the report: “We also worked hard to make sure figures could be intuitively understood… What we really would like is that this whole report helps enhance climate literacy worldwide.”
In the days following the release of the report, climate scientists, graphic designers, and journalists posted various concise explanations of the new graphics. Many news outlets produced their own modified versions as well, though most retained the basic presentation developed by the IPCC’s design team.
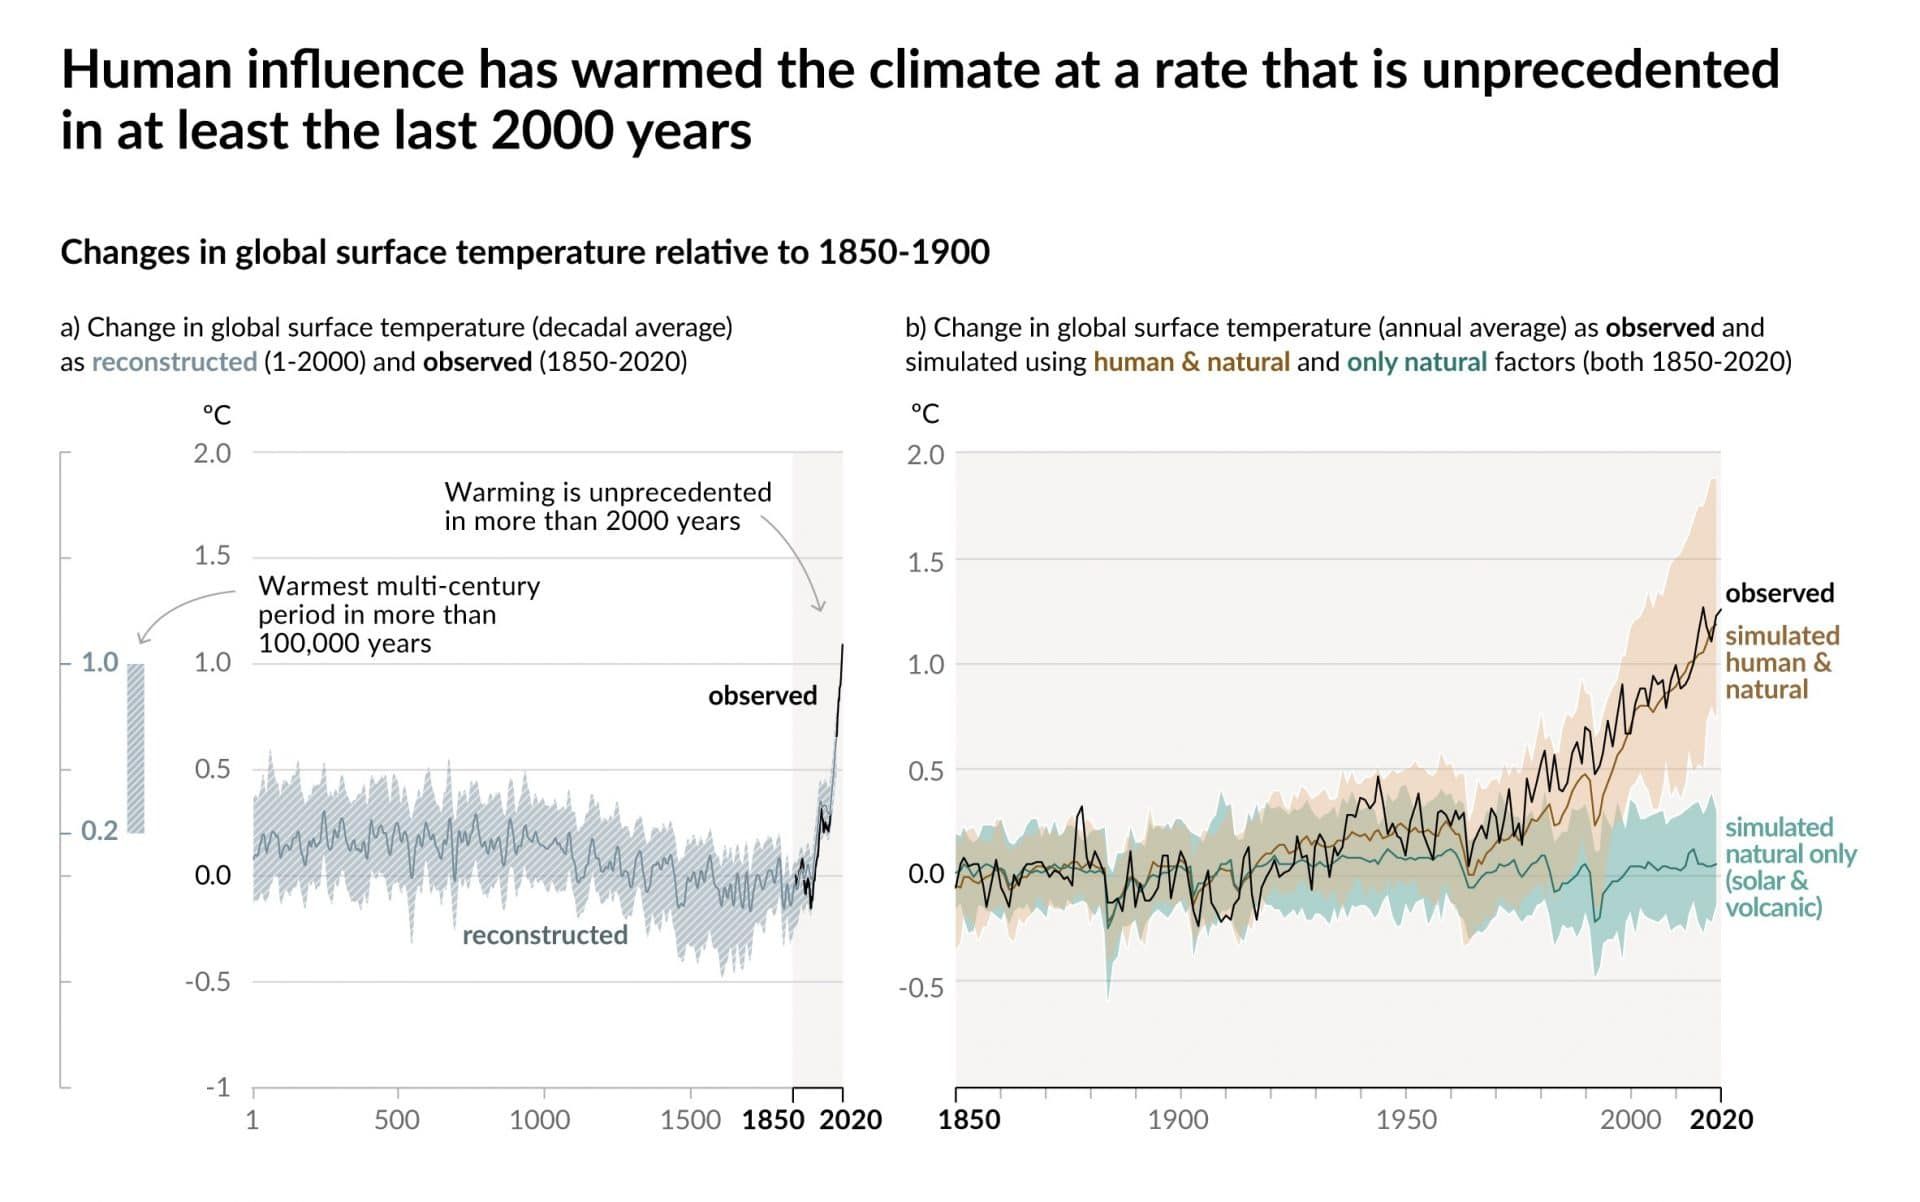
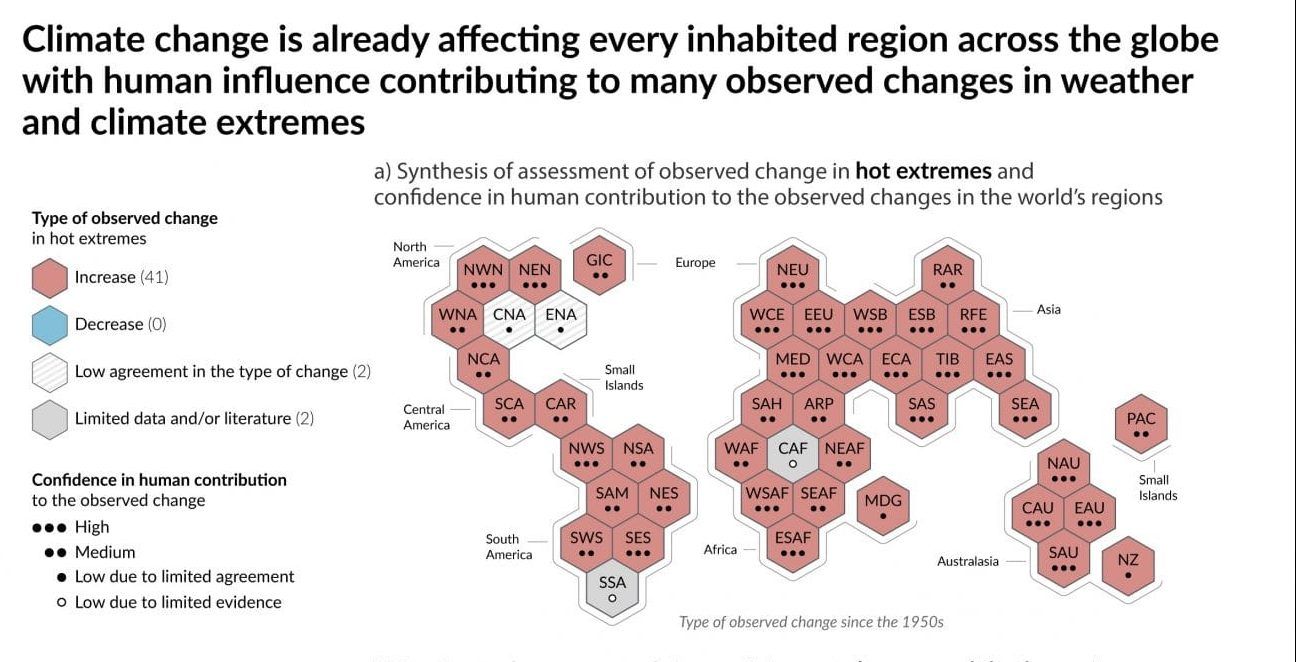
Among the visuals that made the biggest splash were graphs that show the increase in global surface temperatures over the past two millenia (the famous hockey stick, now sharper) and contrast human impact on temperatures with natural influences alone. One of the key messages of the report is the increased confidence scientists have about that human contribution to extreme temperatures—the dots tell that story.
“Together [the graphics and data] tell a clear story of how and why the climate has changed and the effects already experienced in changes to extreme weather,” Hawkins wrote on his blog. “Hopefully these graphics will be widely used to communicate the critical messages [of the report].”
No doubt the authors of every previous IPCC report had similar hopes.
In fact, some of the charts in the very first IPCC science report published in 1990, while devoid of color, are surprisingly similar to those still in use today. One of the clearest representations of the choices facing humanity is a chart projecting global average temperatures under various scenarios:
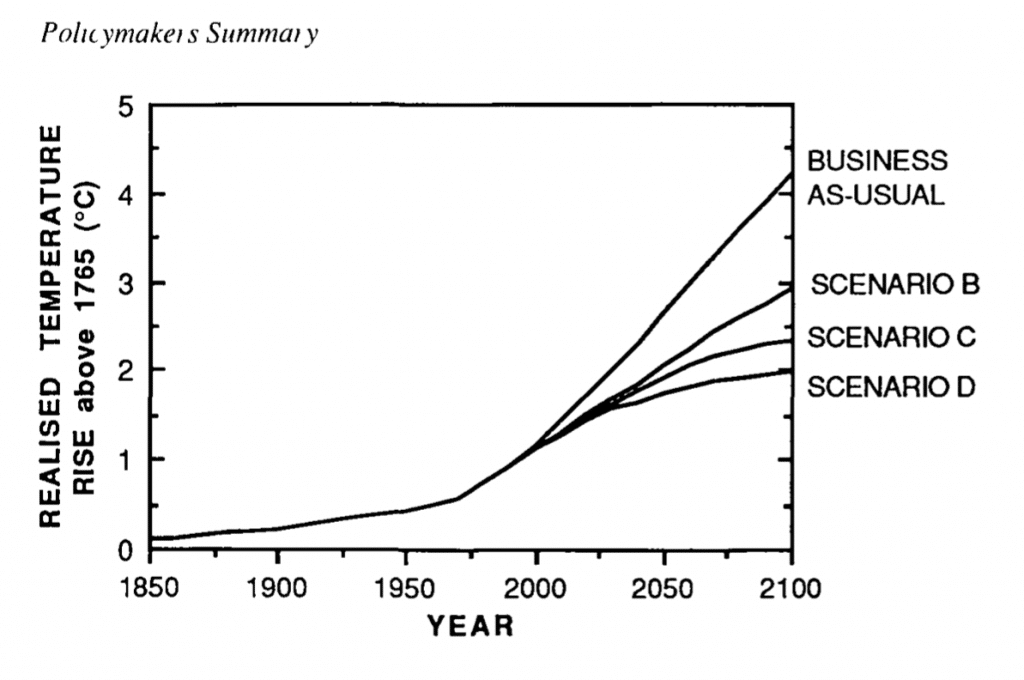
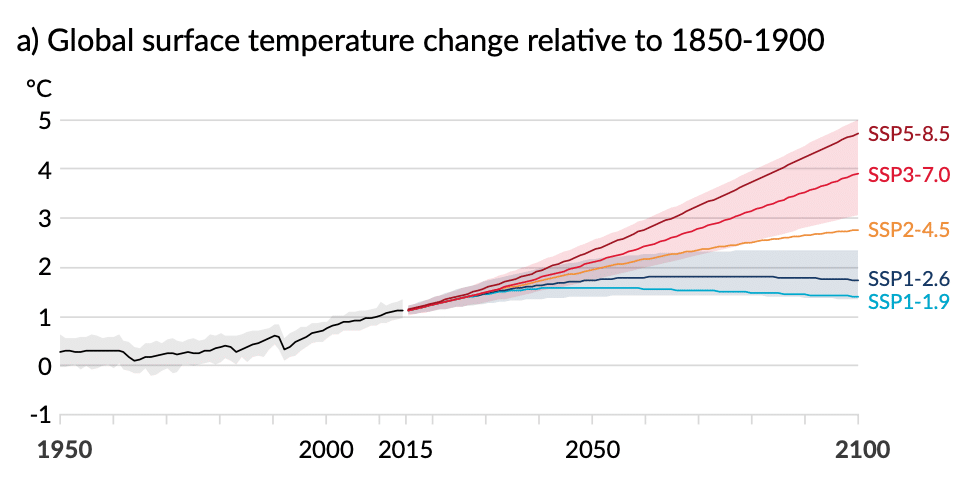
The latest graphic is more optimistic, not just because of the improved color palette. Unlike the 1990 IPCC estimates, the scenarios detailed in the 2021 report account for regional socioeconomic changes (the Shared Socioeconomic Pathway, or “SSP” in the chart) as well as greenhouse gases, and the new chart clearly shows real benefits could be realized in the downward trends of scenarios based on more aggressive emissions cuts.
Whether or not the untrained eye can notice a clear improvement over previous IPCC reports, the graphics help tell the story of looming disaster that—for reasons that have nothing whatsoever to do with science—seemingly needs to be recited over and over again. (Of course, visuals aren’t the only way the IPCC tries to hit people over the head. The text-only “Headline Statements” document also provided by the IPCC is currently the world’s most depressing cheat-sheet, and would be a useful aid at Department of Energy meetings or cocktail parties alike.)
But ultimately, the most remarkable thing about the latest graphics may not be how much better designed they are (which they are), or how widely they might be seen, but rather how elegantly they serve as a reminder that little has fundamentally changed about the underlying climate crisis since scientists first began sounding the alarm more than 30 years ago.
Appendix: IPCC superlatives
Since IPCC reports are full of appendices and annexes, to lighten things up here’s an addendum with my wholly unscientific picks for the most notable visualizations produced for (and inspired by) the latest report:
MOST DEFINITIVE: IT’S OUR FAULT
IPCC: Without human emissions of greenhouse gases (mainly due to burning of fossil fuels), there would be no global warming (see green on chart). pic.twitter.com/6McVbzHZ8q
— Jonathan Overpeck (@GreatLakesPeck) August 10, 2021
MOST (UNINTENTIONALLY?) DISTURBING: THE HOCKEY SCYTHE
— Robert Ingersol (@IngersolRobert) August 10, 2021
MOST OVERLOOKED: THE INTERACTIVE ATLAS
MOST DEPRESSING: AT LEAST
This @IPCC_CH 𝐚𝐭 𝐥𝐞𝐚𝐬𝐭 graphic hit me:
*highest CO2 in at least 2 million years (pre-humans)
*fastest sea level rise in at least 3000 years
*Arctic sea ice smallest area in at least 1000 years
*Glacier retreat largest in at least 2000 yearshttps://t.co/61Lk8CpzrB https://t.co/FEgUYRR7aJ— Andrew B. Watkins (@windjunky) August 9, 2021
MOST LITERAL: FROM CLOUDS TO SEA-BOTTOM
Helpful — yet so frightening! Visual summary of the new @IPCC_CH #ClimateReport, by @WRIClimate.
👉 Time to act is now. 🚨 pic.twitter.com/7cOQ4eUagK— Dr Sandro Demaio (@SandroDemaio) August 9, 2021
MOST IRONICALLY SOLOPSISTIC: XKCD

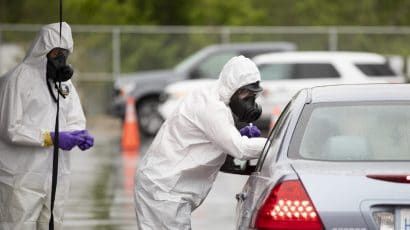
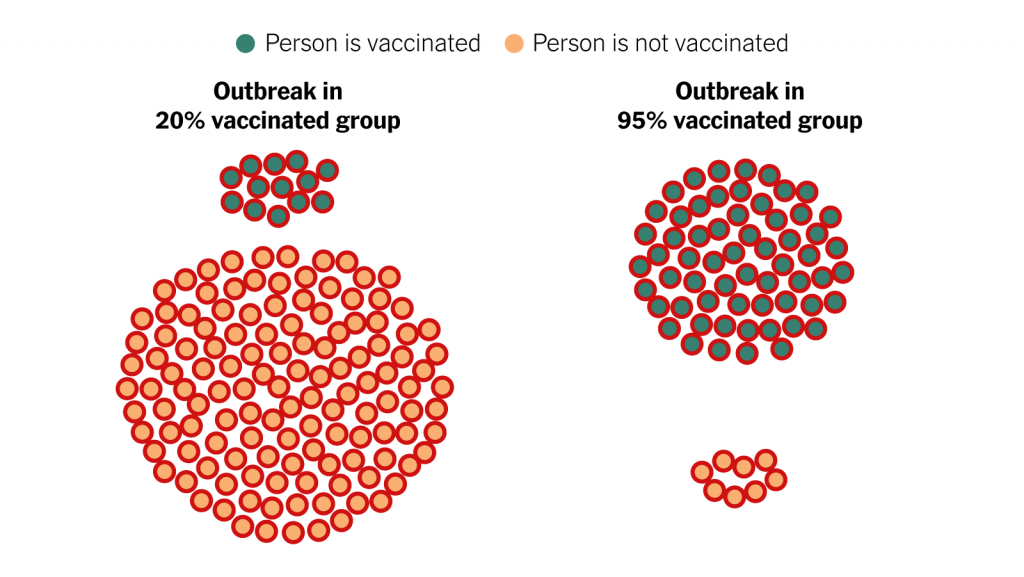
MOST LIKELY TO BE CONFUSED FOR A COVID-19 GRAPHIC: EXTREME EVENTS
This is horribly depressing, but it is a good visualization to explain how rising global temperatures make rare extreme weather events common. From the @IPCC_CH #ClimateReport pic.twitter.com/qxRDRFFYeK
— Sean Casten (@SeanCasten) August 9, 2021
MOST VISUAL SUMMARY OF THE REPORT ITSELF: COLOR CODED CONFIDENCE
MOST IMPORTANT: THE NEXT GENERATION
But after all is said and done, adults (scientists, graphic designers, or otherwise) will never have the talent for visual economy that children do. And it’s the kids—who may grow up having to burn decades of IPCC reports just to survive on the decimated planet they inherit—who should really have the last word, right?
Most concise summary of the IPCC report yet, with graphics. https://t.co/7xKbNvTHlQ
— Dr. Elizabeth Sawin (@bethsawin) August 10, 2021
Together, we make the world safer.
The Bulletin elevates expert voices above the noise. But as an independent nonprofit organization, our operations depend on the support of readers like you. Help us continue to deliver quality journalism that holds leaders accountable. Your support of our work at any level is important. In return, we promise our coverage will be understandable, influential, vigilant, solution-oriented, and fair-minded. Together we can make a difference.
Keywords: IPCC, climate change, climate change communication, graphic design
Topics: Climate Change
Get alerts about this thread
0 Comments
Oldest

Thomas Gaulkin
Thomas Gaulkin is multimedia editor at the Bulletin of the Atomic Scientists. Prior to joining the Bulletin in 2018, he spent the... Read More