What’s climate change really doing to the ocean? Ask the robots
By Mariana Bernardi Bif | January 26, 2022
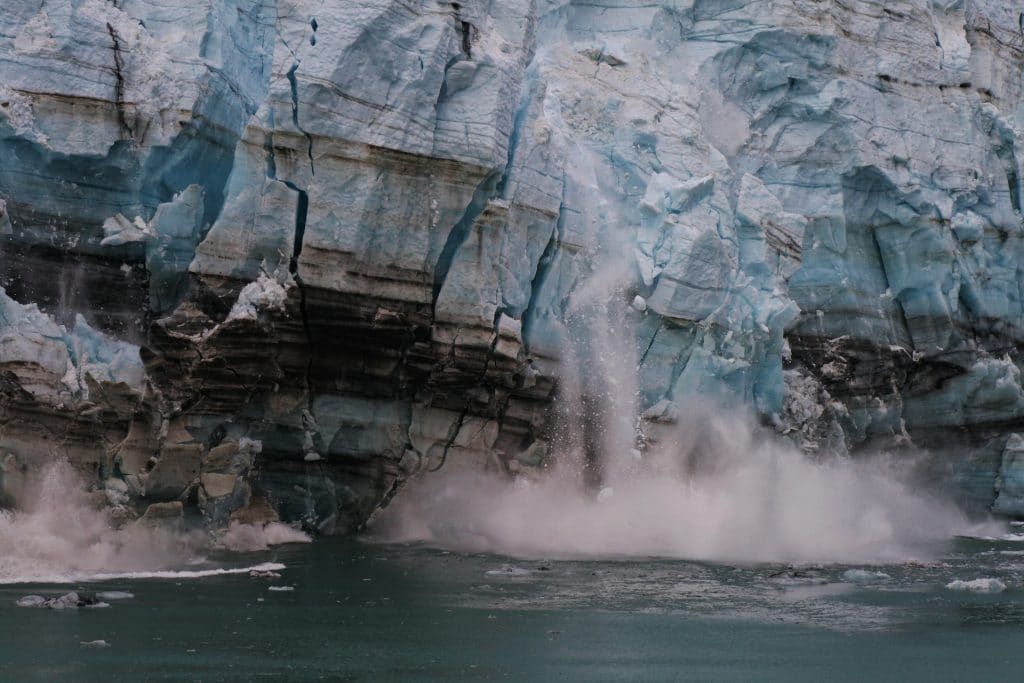 A calving glacier. Photo by NOAA.
Since the 1990s, scientists have deployed thousands of robotic floats equipped with temperature and salinity sensors in the ocean as part of an international effort called the Argo program. These floats have already collected more ocean profiles than all scientific cruises combined. They reveal how ocean temperature and circulation patterns have changed over the years and shed light on the extent that these changes have been caused by humans. But to monitor the impact of climate change on the marine ecosystem—from productivity to fisheries to ocean acidification—scientists need a greater variety of chemical measurements. To that end, research groups around the world have worked in collaboration to develop additional sensors to include on the bodies of Argo floats, turning them into automated biogeochemical floats.
This effort started in the early 2000s with the development of oxygen sensors. Since then, other sensors have been designed to measure acidity, nutrients, pigments, and more, all part of the biogeochemical Argo program. The data collected by these robots enables scientists to observe changes in the deep ocean down to 2000 meters, which would not be possible using satellites that look only at the surface. Since the floats freely drift with ocean currents and move up and down in the water, they also cover broader areas than stationary buoys. Many of these biogeochemical floats have been released in parts of the ocean that are particularly sensitive to climate change, or in undersampled areas that are often too difficult to reach by research cruises, especially during winter when waves and winds are rough.
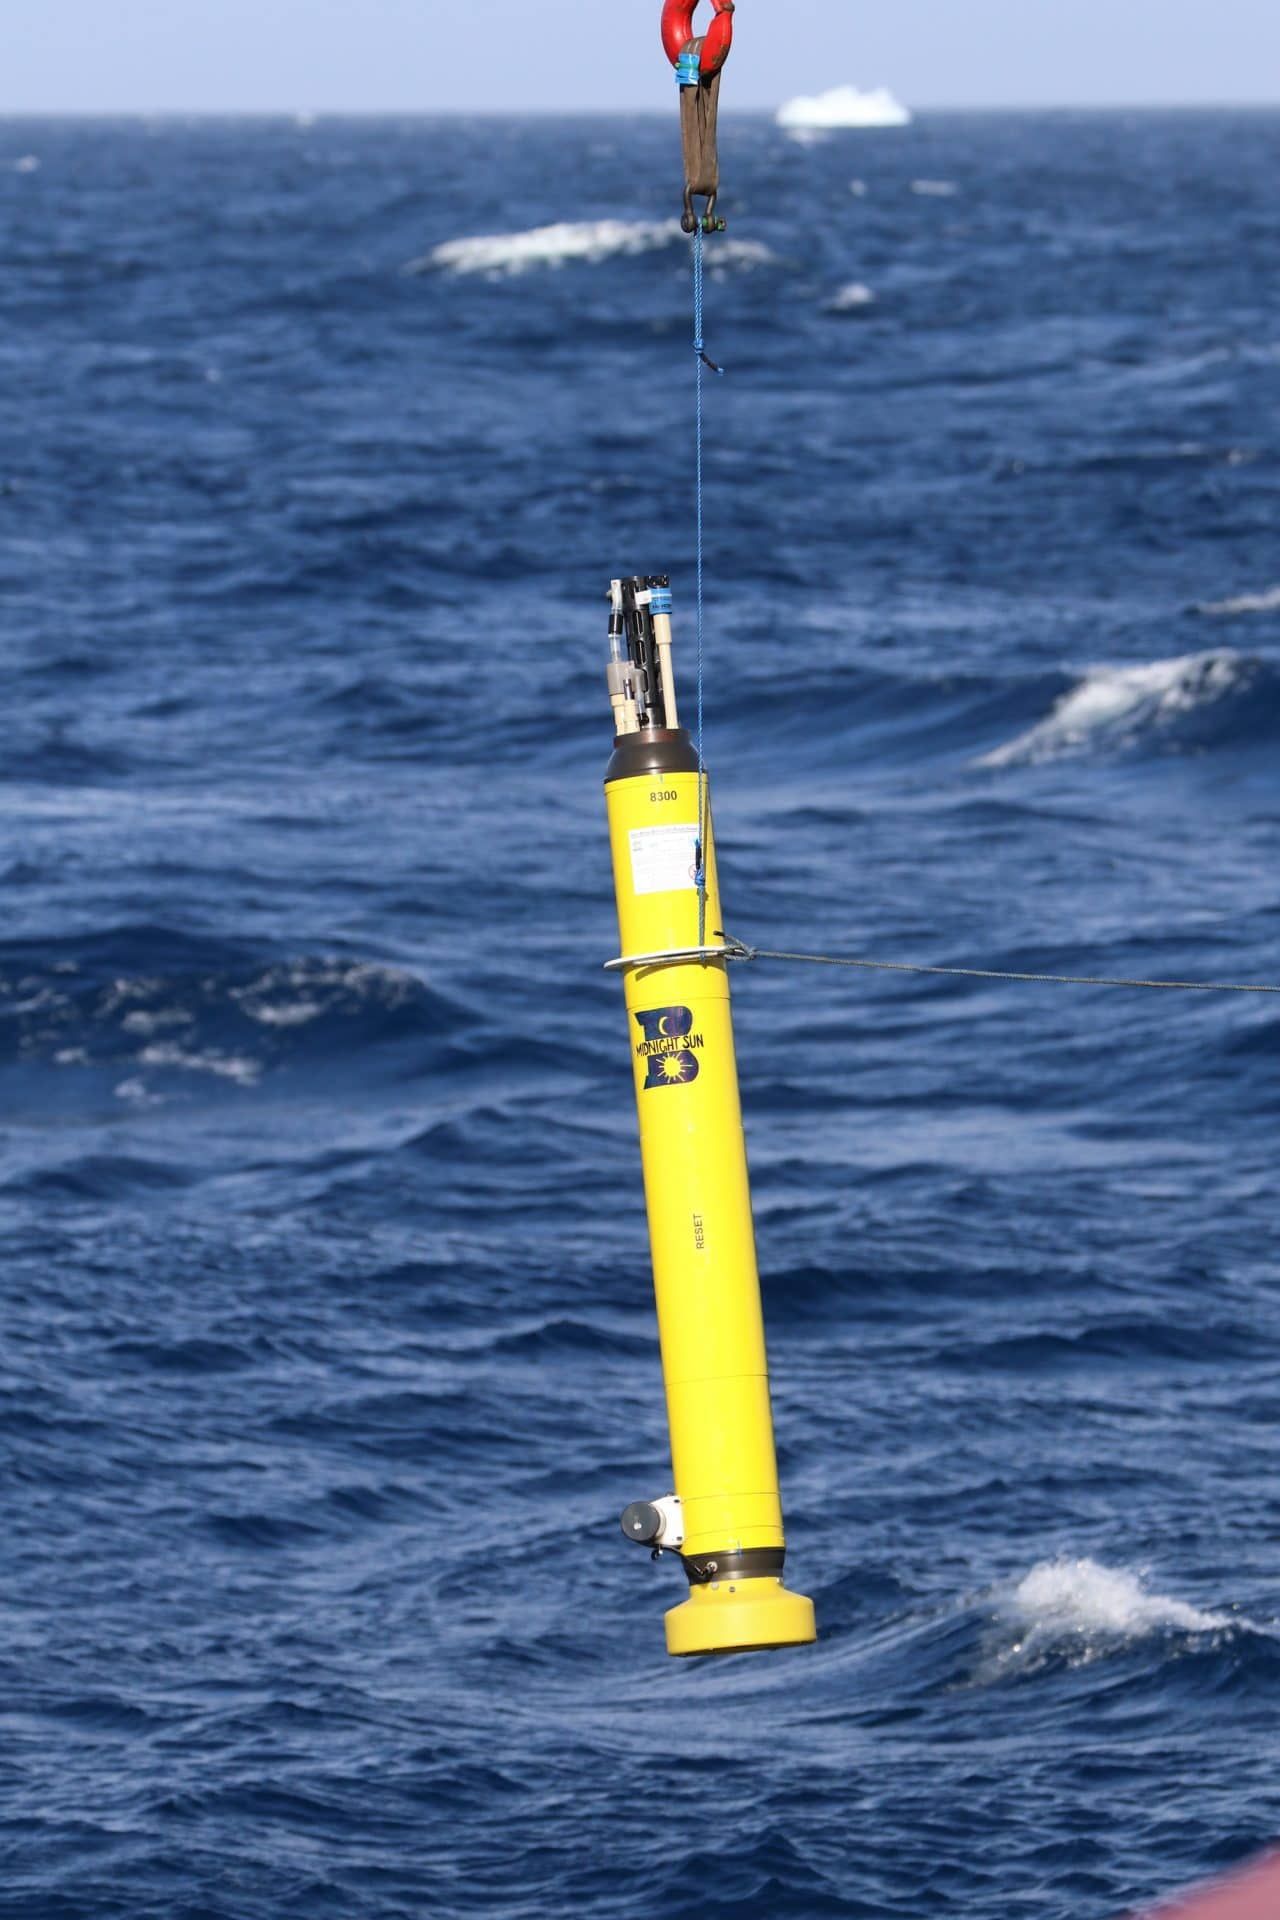
Monitoring the ocean essential to understanding the climate crisis. The ocean plays a vital role in our planet’s health. It generates more than half of Earth’s oxygen and mitigates the human impact on the climate by regulating the amount of carbon dioxide in the atmosphere. Indeed, about a quarter of the carbon dioxide released by human activity is taken up by the ocean. Since the Earth works as one big system, the ocean is constantly exchanging chemical elements, such as carbon and oxygen, with the land, the atmosphere, and living organisms. Scientists need to collect as much data as possible from each environment to understand how the climate operates as a whole. They also need data now, so they have something to compare with the future, and it needs to happen soon, because the climate is already changing.
Despite the need for more information about the ocean, it remains largely unexplored. The ocean covers about 70 percent of the planet’s surface, but humans know less about its floor than the topography of Mars. It’s not for lack of trying. Scientists have been conducting marine expeditions for over a century. More recently, satellites, buoys, and automated robots like the floats have been integrated into what scientists call the Earth’s observing system. By combining robotic technology with research cruises, scientists can now sample difficult-to-access oceanic regions all year long, like the South Pole and the middle of the Pacific Ocean. This observation system provides high-resolution data, meaning that large portions of the ocean are now sampled for long periods of time, with new information generated every few days. This vast data collection is necessary to answer complex climate-related questions such as: How much carbon does the ocean absorb? Are certain regions acidifying faster than others? Are polar waters warming at a faster rate than the rest of the world? Are seasons changing in the ocean just like on land? If so, what are the impacts on the ecosystem and the food web?
By the end of last year, there were 442 active biogeochemical floats in the ocean. Since 2014, the Southern Ocean Carbon and Climate Observations and Modeling project has sent hundreds of robots to the Southern Ocean. These robots have already boosted the amount of data collected around the Antarctic continent and led to astonishing discoveries: Scientists have found that different regions of the Southern Ocean capture different amounts of carbon dioxide, and that waters in that polar region are becoming warmer, saltier, and deoxygenated due to changes in meltwater amounts and wind patterns. They also found that computer models still cannot simulate these changes properly, so clearly, more float data is necessary to help improve climate modeling.
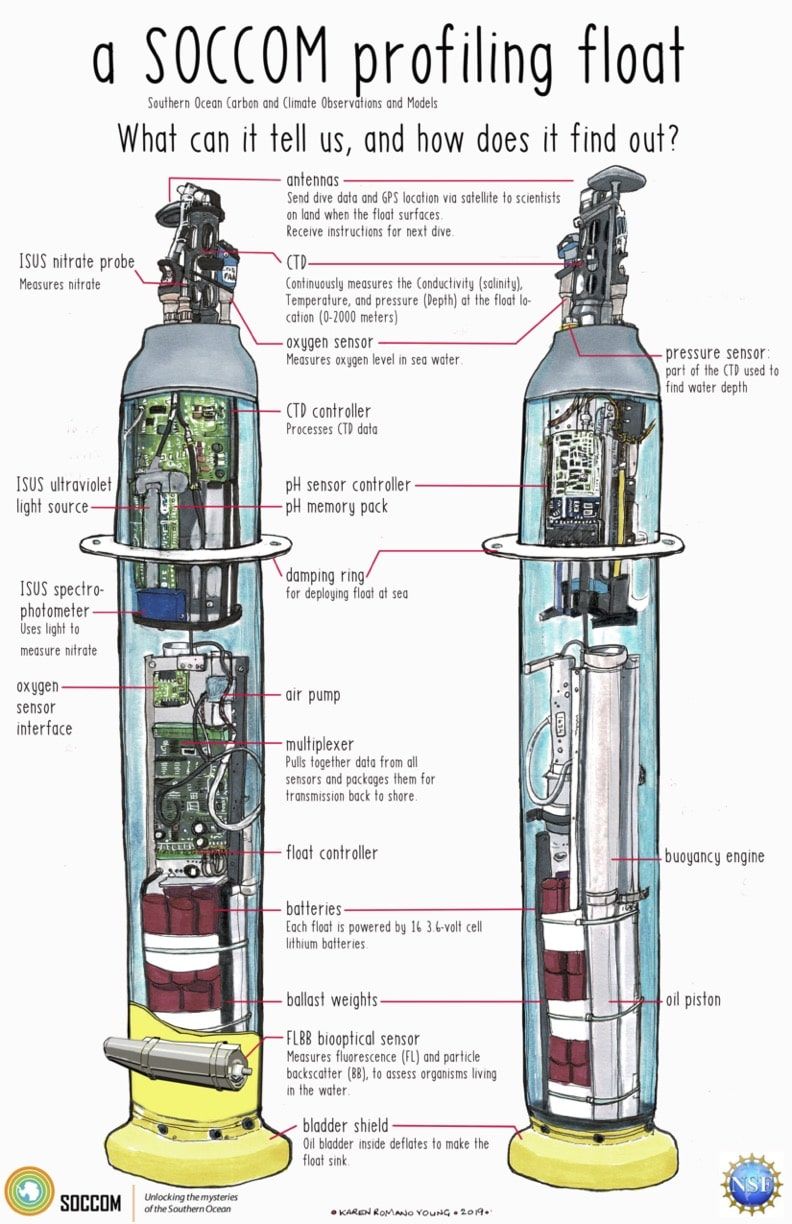
The lifecycle of a float. When biogeochemical floats are released into the water, they are programmed to descend to a depth of 1,000 meters and then drift, following the movement of the ocean. When it’s time to sample, they descend to 2,000 meters and then begin ascending while simultaneously profiling the ocean using the full suite of sensors. They repeat this cycle every five or 10 days. Once at the surface, data are sent via satellite to scientists on land who can then begin processing the data. Quality-controlled data are available in near-real time and free for the world to use. These amazing robots will continue working until their batteries die, in approximately five years, although there have been some record-breakers!
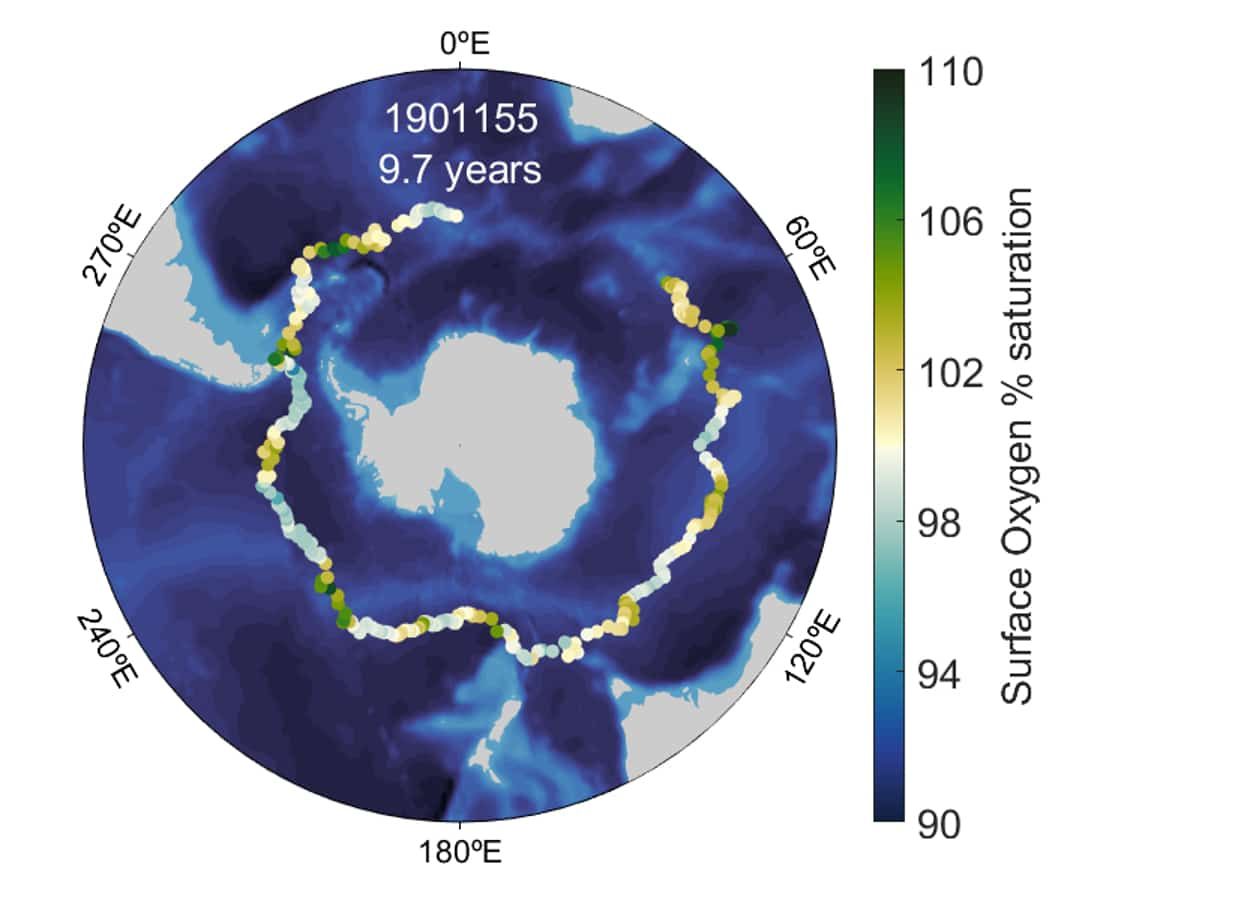
For example, in January 2011, float #1901155 was deployed approximately 46 degrees south of the equator, near the tip of Africa. For almost a decade this intrepid float circumnavigated the Southern Ocean as it traveled east with the prevailing currents. Every 10 days the float woke up and descended over a mile into the ocean depths before beginning its ascent to the surface, measuring pressure, temperature, salinity, and oxygen along the way. Through the data relayed to the mainland, scientists could see how the strong winds and cooler temperatures during winter storms caused the surface and deeper waters to mix, bringing much-needed nutrients to the surface. As winter changed to spring and then to summer, the amount of sunlight hitting the ocean surface increased. These two factors promote phytoplankton growth through photosynthesis, and when phytoplankton grow, they produce oxygen at the same time as they consume carbon to build their bodies. Generally, the surface ocean is in very close equilibrium with the atmosphere with respect to oxygen, meaning the oxygen saturation of the water is around 100 percent. When the ocean becomes supersaturated with oxygen, it indicates increased plankton productivity. This can be seen in the figure below where the yellow to green colors represent supersaturation due to seasonal plankton blooms.
In 2020, the National Science Foundation funded the global ocean biogeochemistry project, a partnership between the Monterey Bay Aquarium Research Institute, the University of Washington, Scripps Institution of Oceanography, Woods Hole Oceanographic Institution, and Princeton University. The goal is to deploy 500 biogeochemical floats in the ocean in five years. The first float was deployed in March 2021 in the northern portion of the North Atlantic Ocean. Since then, 36 other floats have been released. These floats will allow scientists to monitor ecosystem changes, at least for the next decade or so, with remarkable spatial and temporal coverage.
The benefits of robotic ocean monitoring. The data collected by floats from earlier independent projects give a taste of what these robots can do: Using oxygen data collected by the entire fleet of robots, scientists estimated global marine primary productivity, or the amount of atmospheric carbon captured by phytoplankton over a year. It’s the same process that happens on land in terrestrial plants. Changes in productivity due to global warming could change the ocean’s capacity to produce and store carbon. Less productivity would also mean less food available for the entire food web, including fish and whales. Now that scientists have a baseline for marine primary productivity, they can track future changes.
As extreme events increase due to climate change, autonomous robots have already proved to be powerful tools to observe their effects on the marine ecosystem. Between 2013 and 2015, a giant heatwave called the Blob reached the northeast Pacific Ocean and the US and Canadian west coasts. It caused mass mortality of marine organisms and seabirds, triggered harmful algae blooms, impacted fisheries, and even lowered whale birth rates. A few biogeochemical floats happened to be in the region before, during, and after this massive event. Thanks to the long time series of data provided by the floats, scientists were able to conclude that two consecutive years of warming decreased the amount of nutrients available in the ocean’s surface, ultimately crashing carbon production and sequestration in the deep ocean. Floats have also tracked the impact of extreme weather events like typhoon Trami, which tracked near Japan in 2018 and, in that case, had little effect on the ocean’s productivity.
Ultimately, the data collected will help inform lawmakers and stakeholders so they can make mindful decisions on where to allocate resources to minimize economic losses, such as those suffered by the West Coast due to the Blob. During that event, fish stocks moved hundreds of miles from their usual spots, seeking cooler temperatures, and fishing boats couldn’t find them. If scientists only knew at that time, fishermen could have recalculated their route and caught more fish, thanks to these floating robots.
In January, when the undersea volcano on Hunga-Tonga erupted, it sent tons of ash into the atmosphere and the ocean surface. Volcanic ashes are known to fertilize the ocean by bringing nutrients to marine phytoplankton, but they also decrease light availability. While it is too soon to assess the local impact of this volcano to surrounding waters, two biogeochemical floats are already collecting information in the area, floats #6903024 and #6903025. Only by constantly collecting data throughout the ocean can scientists observe ecosystem changes before, during, and after events like this. After all, one never knows when or where the next heat wave or earth-shattering natural disaster will take place.
Together, we make the world safer.
The Bulletin elevates expert voices above the noise. But as an independent nonprofit organization, our operations depend on the support of readers like you. Help us continue to deliver quality journalism that holds leaders accountable. Your support of our work at any level is important. In return, we promise our coverage will be understandable, influential, vigilant, solution-oriented, and fair-minded. Together we can make a difference.
Keywords: carbon sequestration, carbon sink, climate crisis, ocean acidification, oceanography, oceans, robotics, warming oceans, women
Topics: Climate Change








Mariana Bernardi Bif: I’m very interested in this data. Can you tell us what is the average pH of the ocean now? What was it when the robots began measuring pH? Thank you.
Hi Chuck The ocean’s pH varies between the surface and deep waters. Surface waters have pH slightly higher than 8 in average. In the deep, from a few hundreds of meters to thousands of meters, pH falls to 7’s because of higher CO2. It seems like a small difference, but even slightly changes in the pH means that some organisms are not able to survive that. Surface pH has been decreasing with time, and is about 0.1 less from a few decades ago. Falling from low 8’s to high 7’s could mean mass mortality of a lot of organisms, including… Read more »