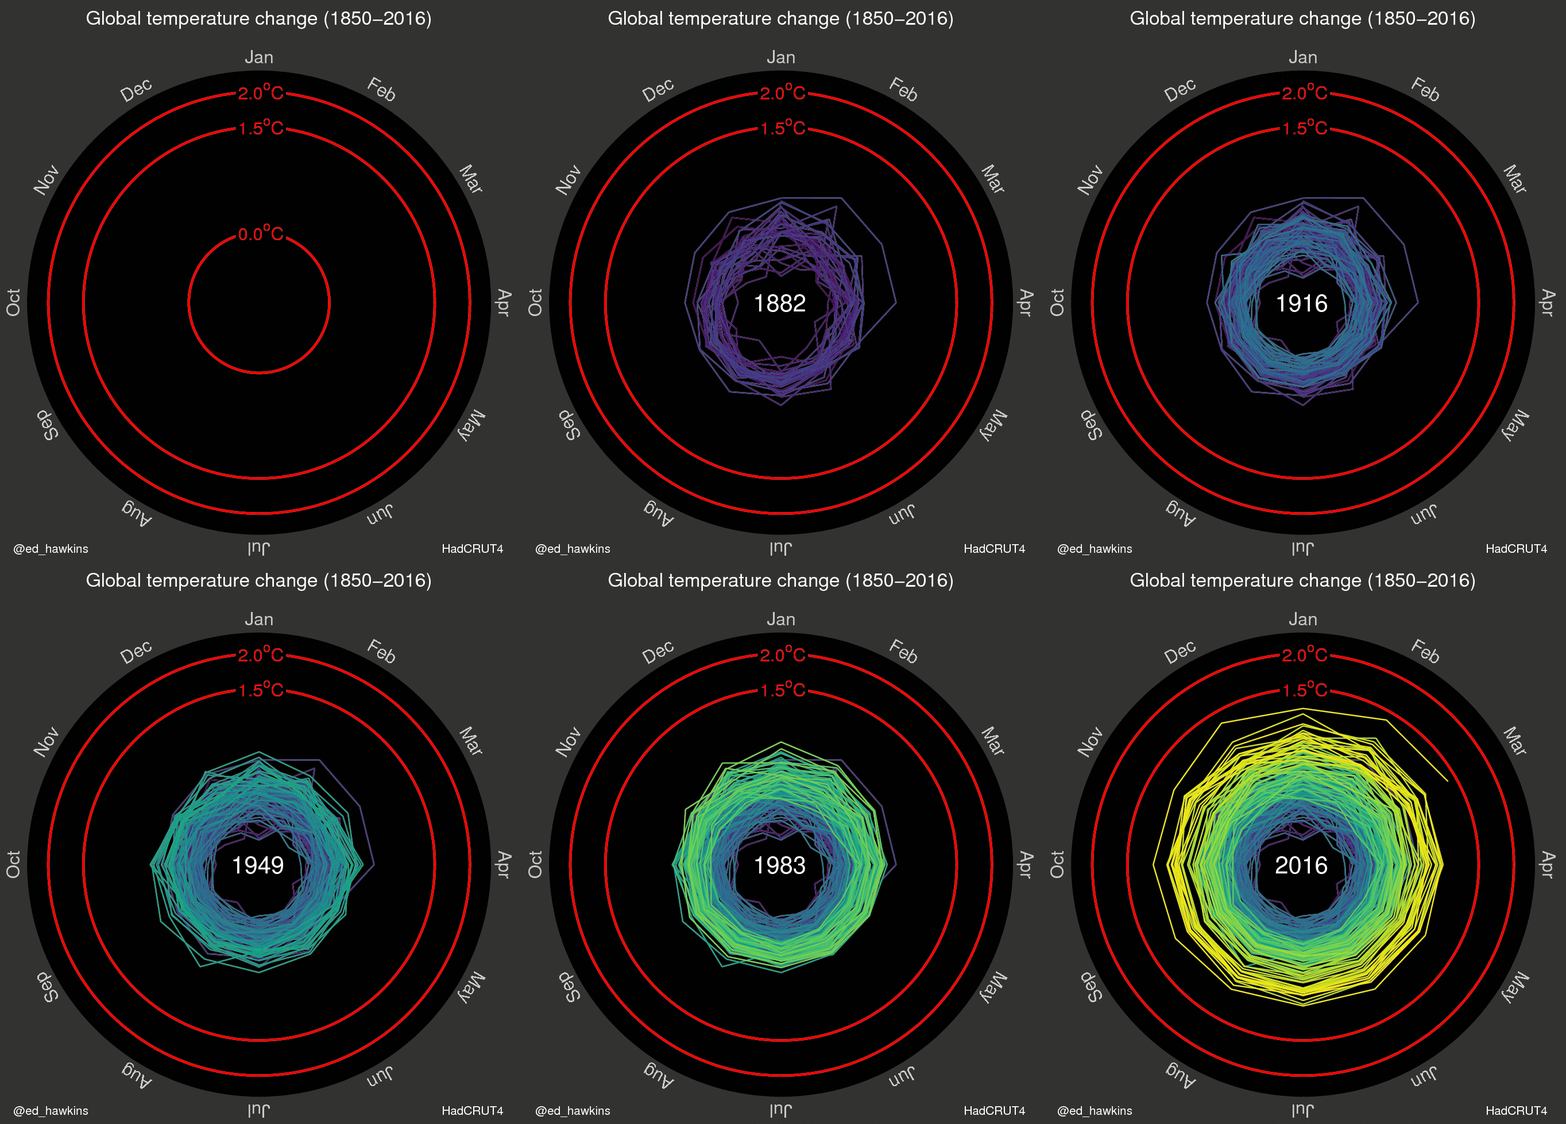
Global Temperature Change
Bulletin Staff | May 12, 2016
Climate scientist Ed Hawkins posted this GIF as a visualization of average global temperatures spiraling upward from the 1850-1990 base period. The graphic has gone viral on social media. Hawkins is editor of the Climate Lab Book, an “experiment” in open-source climate science. The goal of the blog is to promote collaboration through open scientific discussion on climate science, with posts written by climate scientists but open for anyone to see and comment on. Hawkins is with the University of Reading in the UK and an author for the Intergovernmental Panel on Climate Change's Fifth Assessment Report.
