Machine learning improves satellite imagery analysis of North Korean nuclear activity
By Sulgiye Park, Allison Puccioni, Rodney C. Ewing | January 17, 2022
Machine learning improves satellite imagery analysis of North Korean nuclear activity
By Sulgiye Park, Allison Puccioni, Rodney C. Ewing | January 17, 2022
In the midst of what has been termed the “new space race,” a few hundred to tens of thousands of satellites are being approved by the Federal Communications Commission for launch into Earth’s orbit (Venkatesan et al 2020). As of 2021, there are 3,372 operational satellites encircling the planet (Therese 2021). Within a decade, there will be close to 100,000 satellites encircling the Earth (Venkatesan at al 2020). At the same time, remote sensing technology has rapidly developed in terms of quality and applications. Close to 30 percent of all currently operational satellites perform Earth observation missions for applications as diverse as environmental monitoring and border security (Therese 2021).
The utility of these emerging capabilities extends to the arena of international security. For decades, the International Atomic Energy Agency has used satellite imagery to monitor illicit or undeclared nuclear activities as part of its nuclear nonproliferation function (Pabian 2012). Commercial satellite imagery has further enabled nongovernmental organizations and individuals to detect and monitor activities in remote and inaccessible areas, contributing to the rise of open-source intelligence (Park et al 2020). Many institutions use open-source imagery to corroborate, validate, or refute governmental data, improving both the accessibility and rigor of international security analyses.
Much of this utility to security studies is predicated on recent improvements in the temporal and spatial resolution of satellite imagery, enabling the observation and tracking of fine details. Yet increases in the rate of image collection and the detail of the collected images yield a large increase in the amount of data that must be analyzed. Manual analysis of such large datasets is time-consuming, costly, and labor-intensive. To extract relevant information from these images at scale, researchers can use advanced analytics and automated image analysis approaches.
Machine learning is a proposed solution to this challenge. This computational technique has been applied in the field of remote sensing for decades. But only in the past decade have new commercial satellite launches, the availability of powerful graphical processing units, and the rise of cloud computing and deep learning united to make this approach accessible to the security studies community. This has given rise to the emerging discipline of geospatial artificial intelligence, enabling the extraction of information from spatially and temporally detailed data in a timely manner (Trang 2018). By automating hundreds of repetitive tasks such as classification, artificial intelligence techniques such as deep learning can help minimize turnaround time while maximizing the accuracy of results by “learning” from repetitive patterns.
Here, we report on using geospatial artificial intelligence to study activity at critical facilities in North Korea. Due to limitations on access, much of the available data on North Korean state activities comes from earth observation satellites. Governmental and nongovernmental organizations use satellite imagery for myriad security-related purposes, including examination of geopolitical shifts, military power, as well as monitoring social and environmental patterns (Kim et al 2014; Lee et al 2018; Jin et al 2018; Yeom et al 2018). These studies typically use various types of satellite imagery; examples include the use of multispectral images or thermal imagery to identify the extent of nuclear activities (Dinville et al 2016; Albright et al 2018); synthetic aperture radar method to detect surface deformation and environmental changes from nuclear tests (Lee et al 2018; Baek et al 2020); or nighttime lights satellite imagery to detect market and defector activity (Ernst 2016). These techniques provide valuable, timely insights into security-relevant activities. However, most prior studies of this sort used at most on the order of tens of images, severely limiting the temporal dimension and the granularity of such analyses. The large labor and time demands of conventional imagery analysis techniques commonly prevent systematic investigation using large-scale image datasets.
We applied automated image analyses to more than 800 satellite images to track vehicular traffic over periods of up to nine years as a proxy for activity levels at North Korea’s core nuclear facilities. We looked at the Pyongsan Uranium Concentrate Plant, the Yongbyon Nuclear Scientific Research Center (also known as the Yongbyon reactor complex), and the Yongbyon rail station, as well as international trade at border crossings between China and North Korea. The rather sporadic nature of past image collection yields poor temporal coverage of some past periods, which makes assessing trends challenging. But statistical analysis shows a positive correlation between vehicle counts at the Yongbyon reactor complex and railcar counts at the main Yongbyon rail station location one kilometer northwest of the reactor complex. The statistical analysis also shows a positive correlation between cargo and truck counts at Dandong truck yard and Sinuiju truck yard. We observed a significant decrease of vehicle counts on both sides of the Sino-Korean Friendship Bridge following North Korea’s decision to close its borders in response to the COVID-19 pandemic.
Earth observation and machine learning-based imagery analysis
Earth observation sensors provide two types of images: multispectral images that capture data in multiple bands and, as a result, have high spectral resolution; and panchromatic images with a single band that combines the information from visible bands and have high spatial resolution. Multispectral images cover the visible and infrared portions of the electromagnetic spectrum, while panchromatic images have a single intensity value per pixel that is rendered and visualized in greyscale. While multispectral images are often used to obtain spectral information invisible to the human eye, panchromatic images are used for object detection benefiting from its high spatial resolution. For improved information retrieval, however, multispectral and panchromatic images can be fused, using intensity substitution or pan-sharpening processes. The procedures combine three bands from the multispectral image with the high spatial resolution panchromatic image to produce an output that couples the benefits of high spatial and spectral properties.
For this study, we used 50-centimeter resolution panchromatic image from Airbus in Orbital Insight’s GO platform. The platform provides its own inhouse training data for machine learning algorithms to automatically detect objects in an image. As a discipline within artificial intelligence, machine learning includes an algorithm that uses data to make decisions. The platform combines deep learning, a family of machine learning algorithms with computer vision algorithms, which involves acquiring, processing, and analyzing commercial satellite images to provide geospatial insights. The automated methods developed by Orbital Insight use a type of deep learning algorithm, known as convolutional neural networks for visual recognition. The architecture analyzes each component of an image, and iteratively conducts analysis until the network has developed a comprehensive picture of the image. By doing so, the convolutional neural network detects a variety of objects in images, classifies subtypes of objects, and identifies pixel-to-pixel changes between images from space-based data sources. Convolutional neural networks enable greater accuracy of calculations as compared with conventional methods that require higher labor costs (Rukhovich et al 2021).
Counting vehicles in Pyongsan and Yongbyon
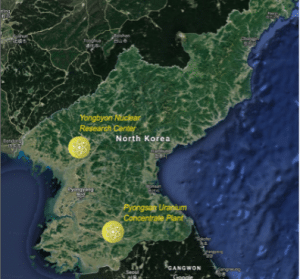
For the past six decades, North Korea has operated a large nuclear weapons program. The Pyongsan Uranium Concentrate Plant is where natural uranium ore is milled, making it useable for the production of fissile materials. The Yongbyon Nuclear Scientific Research Center is where major facilities include nuclear reactors, a fuel fabrication plant, an enrichment facility, and a reprocessing facility. Both are key facilities at the heart of North Korea’s nuclear program.
As the only operational and confirmed source of yellowcake—a precursor material to nuclear weapons and fuels—the mine and ore-processing (milling) facilities at Pyongsan are critical components in the very first steps of North Korea’s nuclear fuel cycle. Yellowcake processed at the Pyongsan plant is then transported to Yongbyon Nuclear Scientific Research Center, where the materials undergo further processing for fueling the reactors, or are enriched to make highly enriched uranium for weapons use. The uranium is then irradiated to produce spent fuel at the Yongbyon reactor complex. The spent fuel is then taken to the reprocessing facility, from which plutonium—a weapons-usable fissile material—is produced.
Researchers often determine the operational status of these facilities by observing effluent discharge, such as smoke plumes or water vapor emissions that indicate operation of steam turbines or generator halls. They may also observe waste accumulation, such as the build-up of mill tailings generated from uranium ore mining and processing. Additionally, vehicle traffic (including car, truck, and rail activity) and personnel movements can indicate operational status and facility activity level. All these features are recognizable using satellite imagery, particularly when the images achieve high spatial resolution. Typically, an analyst or a group of analysts identify and determine the objects of interest as the basis of intelligence analysis. However, processing of the large quantities of satellite imagery necessary to quantify the analysis is costly and time-consuming when using manual image analysis techniques.
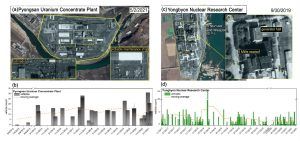
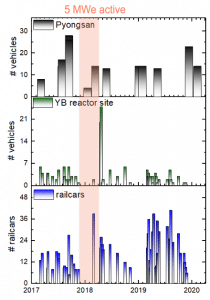
In this case study, we applied an automated vehicle-detection algorithm to imagery of the Pyongsan milling facility and Yongbyon reactor site to count the number of trucks, cars, and railcars present as a function of time. We assessed this count as a possible proxy for each facility’s overall operational activity level over time. We used the following image counts for each facility: 35 for Pyongsan from the periods of 2013 to May 2021; 148 for Yongbyon from January 2017 to May 2021; and 62 for Yongbyon rail stations from March 2017 to November 2019.
Figures 2 and 3 show the results of our analysis, alongside representative satellite images. We marked detected vehicles with brown dots. At Pyongsan, we observed trucks in a building that is likely a maintenance shop. We also regularly saw various types of railcars on small railroads within the milling facility. The number of vehicles at the Pyongsan milling facility varies, but we surveyed an average of 15 vehicles in each image, primarily railcars. Similarly, the number of vehicles at the Yongbyon reactor site fluctuates with time. On images made available for this site, there are an average of approximately three vehicles in the form of trucks east of the 5 megawatt electrical nuclear reactor.
In addition to counting vehicles at the Pyongsan milling facility and Yongbyon reactor site, we counted railcars at the main Yongbyon rail station. The most probable scenario is that yellowcake processed at the Pyongsan milling facility is transferred in 55-gallon steel drums carried by freight cars. These freight cars pass through 33 rail stations to reach the main Yongbyon rail station, located approximately one kilometer northwest of the nuclear reactors. The freight car counts at the Yongbyon rail station can provide a clue into the activity level at the core nuclear facilities. In this analysis, we considered each observed freight car a single count.
The number of railcar counts fluctuates with time. (Note that all images are taken between 10 am to noon local time. The numbers of vehicles noted here represent only of those spotted between 10 am and 12 pm local time.) In our satellite images analysis, we noted the highest railcar count in July. While we observed fewer vehicles at the reactor site, we found a modest positive correlation between the railcar count at the Yongbyon rail station and truck counts at the Yongbyon reactor site.
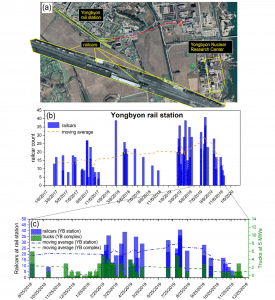
Effluent discharge provides a direct signature of facility operation, but vehicle traffic provides insight into overall facility activity. The latter includes operations, as well as other on-site activity, including construction, renovation, and commissioning or decommissioning (Figure 4). In the past, analysts did not regularly collect satellite imagery, which partly explains the lack of correlation. As satellite constellations grow, they will provide more images more often, which should mitigate this problem.
Monitoring trade relationships by imaging border crossings
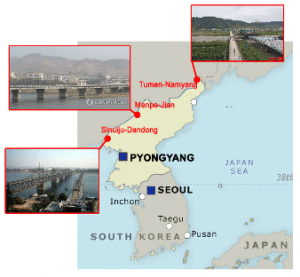
China is North Korea’s dominant trade partner, accounting for more than 90 percent of its international trade. The two countries engage in bilateral trade via various routes. Most of the more important routes include the Sino-Korean Friendship Bridge, the Manpo-Jian railroad crossings, and the Tumen-Namyang road bridge (Figure 5).
The Chinese General Administration of Customs and the Korea Trade-Investment Promotion Agency periodically release data on bilateral China-North Korea trade, the latter of which includes adjustments for unreported Chinese crude oil exports to North Korea (East-West Center of the National Committee on North Korea 2020). Data from the Korea Trade-Investment Promotion Agency indicates a gradual increase of total trade volume between China and North Korea from 2000 until 2013, when China stopped reporting its crude oil exports to North Korea. Trade volume then began to decrease, coinciding with the strengthened United Nations’ sanctions imposed in 2017 following North Korea’s nuclear tests. The most dramatic decrease of trade was in 2020 with the outbreak of COVID-19, with more than an 80 percent decrease in trade after North Korea’s strict lockdown policy closed off all points of entry.
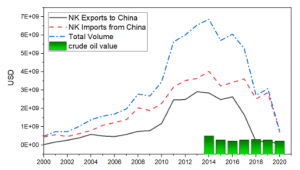
These customs data provide valuable insights for assessing the general economic activities between the countries. The accuracy of these data, however, is often questioned as Beijing attempts to hide and obscure certain merchandise trade, or as North Korea conducts illegal smuggling across the border (Wertz 2020). Analysts mitigate such oversights and review and monitor trade activities by using satellite imagery to observe vehicle traffic across the entry points.
Researchers with access to additional imagery are able to conduct more detailed analyses but require automated techniques. We analyzed a total of 360 images and applied automated vehicle counting to three major routes between North Korea and China from 2016 to 2021 to quantify trade activity. Figure 7 illustrates the number of trucks and cargos stationed in custom stations, Dandong in China, and Sinuiju in North Korea, across the border.
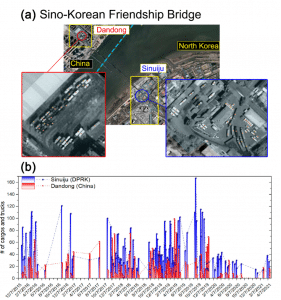
We observed significant fluctuations in the vehicle counts, but a generally decreasing trend since 2017 on both sides of the border, with an increase in 2019. These observations agreed with the trade data from the Korea Trade-Investment Promotion Agency.
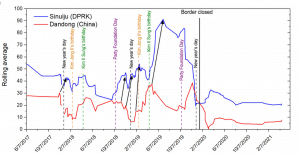
An eight-month rolling average further depicts a notable trend. That is, the upward trend in the average counts on the Dandong depot precedes that on the Sinuiju, a possible sign that goods are exported from China to North Korea. The truck counts in the Sinuiju truck depot increase in May 2019, while they decrease in Dandong. This trend continues until October 2019, when the truck count plummets following a short rise in December of 2019. The data from 2020 and 2021 indicate a significantly reduced number of vehicles on both depots, as expected from border closings in response to the COVID-19 pandemic. In 2020, the average vehicle counts in Sinuiju and Dandong are two- and four-fold lower, respectively, as compared with those of 2019.
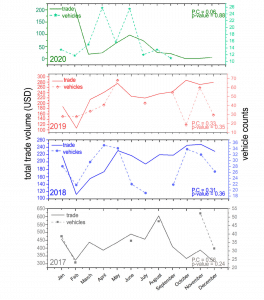
Figure 9 illustrates a further comparison to the monthly total trade volume data from China’s General Administration of Customs. While insufficient imagery makes it difficult to systematically assess trends, there are weak positive correlations between the monthly total trade volume and the truck counts observed at both sites for 2017-2020.
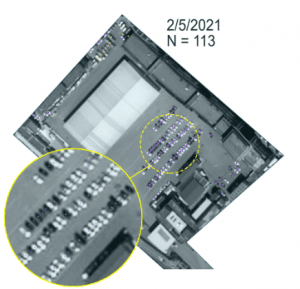
The China-North Korea border for trade may potentially open, according to recent reports (Onchi and Watanabe 2021). While it is still too early to confirm this reported opening, we observed 113 vehicles in Dandong on May 2nd, 2021, which is the greatest number of vehicles present since the border was closed (Figure 10). Among the 113 vehicles, 78 of them were identified as sedans, parked in the truck yard next to the customs station. Whether or not these sedans are a part of trade with North Korea is not clear.
Counting parked vehicles at the truck yards has limitations. Images of parked cars do not fully represent vehicle traffic. Trade can also occur during nighttime when images are not readily available. However, given the sparse available information, and no easy verification method, this is one of the only methods to study and measure trade between North Korea and China. Since satellite companies collected images around the same time of the day (10 am and noon local time) for this region, future investigations might focus on a comparison of truck counts through time and an analysis of the overall trend. With rapid revisit of satellite monitoring, which decreases time intervals for which images are being captured, and increased frequency of imagery collection, analysts can improve monitoring of trade across the shipping routes.
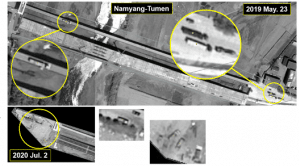
While the narrow bridge and complex architectural features of the Sino-Korean Friendship bridge hinder detection of vehicles on the bridge, the Namyang-Tumen road bridge has an opening, making possible observation of vehicles on the bridge. We applied a truck-counting algorithm to a total of 45 images from 2019-2021. Figure 11 illustrates an example of a cargo truck on the Namyang-Tumen bridge towards North Korea. While we occasionally observed fewer than five trucks on either side of the border, we did not see any vehicles on the bridge before and after May 2019.
Machine learning bests conventional methods for large satellite dataset analysis
Machine learning is useful in analyzing large satellite imagery datasets. Our North Korean case studies demonstrate the feasibility of using a combination of computer vision algorithms and deep learning to analyze activities in restricted regions. The time it took to process the images, which ranged from a few minutes up to a few days, depended on the size of the chosen region, class of algorithm, and the available number of satellite images. This is significantly faster than what can be achieved from conventional methods.
Applying machine learning techniques to Earth observation imagery benefits international security. While our work showcases the opportunity and efficacy of these tools for analyzing large sets of imagery, it also has several limitations. The number of false positives increases with the complexity of the background and noise, including clouds and snow cover, while the number of false negative increases with the intended and unintended jamming caused by obstacles such as buildings or vegetation. To mitigate miscounts, humans intervened to revise and adjust counts in some satellite images. Furthermore, our study was limited by the irregular timing of the imagery and large temporal gaps. Still, as greater quantities of imagery become available from quickly expanding satellite constellations, our approach presents an opportunity for improved facility tracking. Automation can help increase the efficiency of analytics, especially those involving big data, yielding more time to conduct follow-up studies and faster results aimed at safeguarding against covert nuclear activities.
References
Albright, D., Burkhard, S., Lach, A. 2018. “Commercial Satellite Imagery Analysis for Countering Nuclear Proliferation.” Annual Review of Earth and Planetary Sciences 46(1): 99-121. https://www.annualreviews.org/doi/abs/10.1146/annurev-earth-063016-015704?casa_token=G8dRhGNRnFoAAAAA:JpZMGSr7LWCPYaKhMnWX9Huu7RwnCs46d0BxQ8JK5sC9jB7WkGtIQPUFIS_cg0yL6Rk-Q69WVwtZRA
Baek, WK., Jung, HS. & Kim, T.S. 2020. “Satellite radar observation of large surface collapses induced by the 2017 North Korea nuclear test.” Scientific Reports 10 (17833).
Dinville, A., Bermudez, Jr. J. S. 2016. “Checks and Balances: Thermal Imagery Analysis of Yongbyon. 38North.” October 25. https://www.38north.org/2016/10/yongbyon102516/. Accessed July 2 2021.
Ernst, M., Jurowetzki, R. 2016. “Satellite data, women defectors, and black markets in North Korea: A quantitative study of the North Korean informal sector using night-time lights satellite imagery.” North Korean Review. 12(2): 64-83.
East West Center of the National Committee on North Korea. 2020. “China-DPRK Merchandise Trade Volume.” https://www.northkoreaintheworld.org/china-dprk/total-trade
Kim, KH., Lee, SH. and Choi, JY. 2014. “An analysis of agricultural infrastructure status of North Korea using satellite imagery.” Korean National Committee on Irrigation and Drainage. 21(1): 45-54.
Lee, WJ., Sun, JS., Jung, HS., Park, SC., Lee, DK. and Oh, KY. 2018. “Detection of surface changes by the 6th North Korea nuclear test using high resolution satellite imagery.” Korean Journal of Remote Sensing, 34 6-4: 1479-1488.
Jin, Y.; Sung, S.; Lee, D.K.; Biging, G.S.; Jeong, S. Mapping Deforestation in North Korea Using Phenology-Based Multi-Index and Random Forest. 2016. Remote Sensing. 8: 997. https://doi.org/10.3390/rs8120997.
Onchi, Y. and Watanabe, S. “North Korea prepares to resume trade with China,” Nikkei Asia, August, 9 2021. https://asia.nikkei.com/Spotlight/N-Korea-at-crossroads/North-Korea-prepares-to-resume-trade-with-China. Accessed October 2021.
Pabian, F. V. 2012. “Strengthened IAEA safeguards-imagery analysis: Geospatial tools for nonproliferation analysis.” Los Alamos National Laboratory. https://irp.fas.org/eprint/safeguards.pdf
Park, SW., Kim, NK., Han, JJ., Jeong, DY., Kwak, TH. and Kim, YI. 2020. “Development of object-based change detection method in restricted areas using GIS thematic data.” SPIE Proceedings 11540, Emerging Imaging and Sensing Technologies for Security and Defence V; and Adanced Manufacturing Technologies for micro- and Nanosystems in Security and Defence III.
Rukhovich, D.I.; P.V. Koroleva, D.D. Rukhovich, N.V. Kalinina. 2021. “The Use of Deep Machine Learning for the Automated Selection of Remote Sensing Data for the Determination of Areas of Arable Land Degradation Processes Distribution.” Remote Sensing. 13: 155. https://doi.org/10.3390/rs13010155
Therese, W. 2021. “Visualizing All of Earth’s Satellites: Who Owns Our Orbit?” Accessed 2021. January. https://www.visualcapitalist.com/visualizing-all-of-earths-satellites/
Vopham, T., Hart, J.E., Laden, F., Chiang, Y-Y. 2018. “Emerging trends in geospatial artificial intelligence (geoAI): potential applications for environmental epidemiology.” Environmental Health. 17: 40.
Venkatesan, A., Lowenthal, J., Prem, P., Vidaurri, M.. 2020. “The impact of satellite constellations on space as an ancestral global commons.” Nature Astronomy 4: 1043-1048.
Wertz, D. China-North Korea Trade: Parsing the Data. 2020. 38 North. February 25th. Accessed on July 2nd 2021. https://www.38north.org/2020/02/dwertz022520/
Yeom, JM., Jeong ST., Jeong, GY., Ng, CT., Deo, RC. and Ko, JH. 2018. “Monitoring paddy productivity in North Korea employing geostationary satellite images integrated with GRAMI-rice model.” Scientific Reports. 8, 16121.
Together, we make the world safer.
The Bulletin elevates expert voices above the noise. But as an independent nonprofit organization, our operations depend on the support of readers like you. Help us continue to deliver quality journalism that holds leaders accountable. Your support of our work at any level is important. In return, we promise our coverage will be understandable, influential, vigilant, solution-oriented, and fair-minded. Together we can make a difference.


