Could an attack on Ukrainian nuclear facilities cause a disaster greater than Chernobyl? Possibly, simulations show.
By Jungmin Kang, Eva Lisowski | March 23, 2022
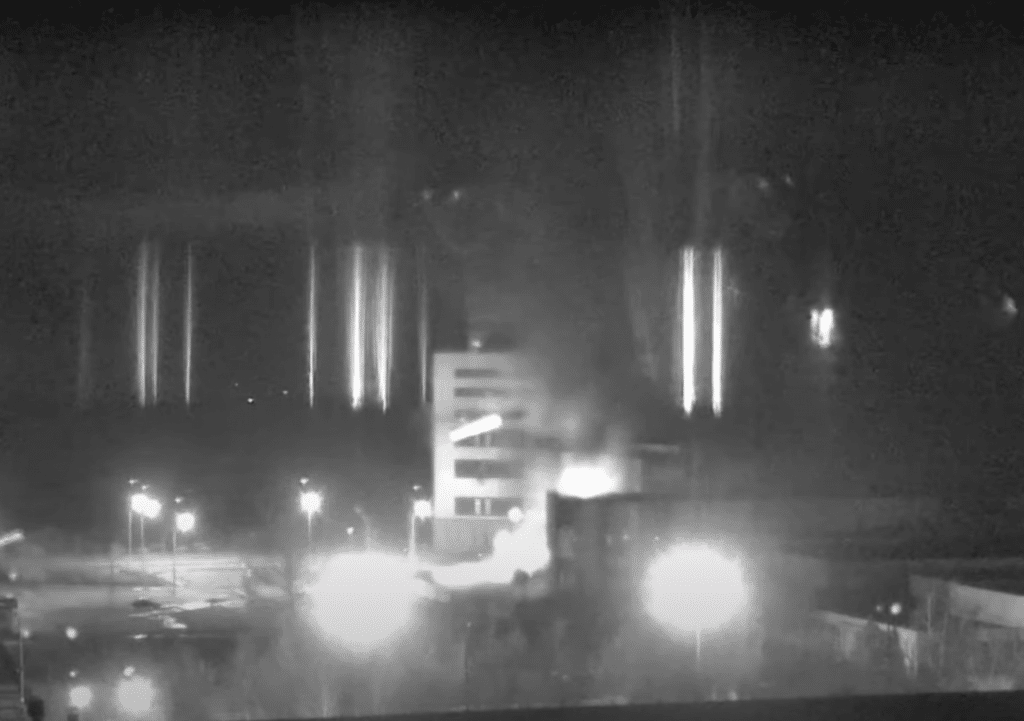 Screenshot of a video of the Russian attack on the Zaporizhzhia nuclear power plant
Editor’s note: The simulations described in this article do not reflect a current or predicted situation in Ukraine. To stay updated on the current situation at nuclear power plants in Ukraine and across the world, visit the website of the International Atomic Energy Agency at https://www.iaea.org/.
As Russian military forces shelled the Zaporizhzhya Nuclear Power Plant (ZNPP) in southern Ukraine on March 4, 2022, a fire broke out on the site. Among the six reactor units at the complex, auxiliary buildings attached to the Zaporizhzhya Unit 1 reactor were damaged. Fortunately, the damage did not threaten the safety of the unit.[1] And a recent assessment by the International Atomic Energy Agency indicates that, although management of the plant by a Russian military commander is less than ideal, “regular staff have continued to operate the Zaporizhzhya [nuclear power plant]” and “at least 11 representatives of the Russian state [nuclear power] company Rosatom were also present there, without interfering with the operation of the nuclear facilities.”
Even so, Russia’s military attacks on the Zaporizhzhya plant raise great concerns about the possibility of nuclear accidents. Some experts have suggested the attack on Zaporizhzhya could have caused a huge catastrophe; others were much more conservative in their estimates of possible radiation releases from such an attack. To illustrate the potential damage from a military attack on a nuclear power plant, we simulated and analyzed hypothetical releases from a core meltdown and spent fuel pool fire at one unit, Zaporizhzhya 1, if an attack by missiles or artillery had disabled cooling systems there.
Military attacks that disable a nuclear power plant’s safety systems, including reactor cooling and power systems, could lead to a core meltdown, as happened at the Fukushima Daiichi nuclear power plant in Japan in 2011, when an earthquake and ensuing tsunami disabled safety systems and caused three core meltdowns. Failure of cooling systems for a spent fuel storage pool can lead to an increase in the temperature of the fuel. If cooling is not reestablished, spent fuel that has been removed from the reactor for less than a few months can heat to temperatures on the order of 1,000 degrees Celsius and cause the zirconium cladding on fuel assemblies to catch fire and release radiation. The fire can spread to cooler spent fuel, too.
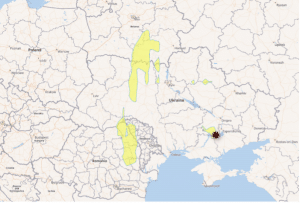
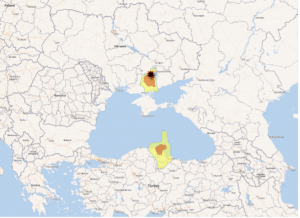
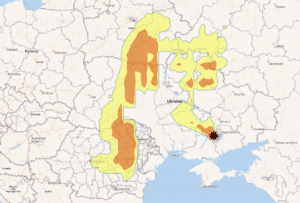
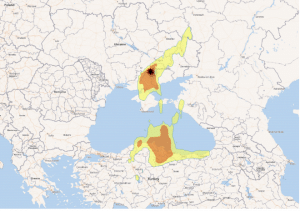
As shown in the maps and tables below, a meltdown and/or spent fuel pool fire could force large population relocations in up to five countries, depending on the the type of nuclear incident and weather patterns.
Zaporizhzhya 1 is a pressurized water reactor with an electric power capacity of 950 megawatts-electric; it has been operated since 1984.[2] For our simulation, we assumed a cesium 137 release of 157 petabecquerels of radioactivity due to a nuclear core meltdown of the reactor, which is 50 percent of the cesium 137 core inventory.[3] For a spent fuel pool fire occurring in the Zaporizhzhya Unit 1 spent fuel pool, we assumed a cesium 137 release of 590 petabecquerels, which is 75 percent of the pool inventory of cesium 137.[4]
To assess the impact of radiological fallout on the population and land area, the atmospheric dispersion following the releases was simulated using the Hysplit[5] model provided by the National Oceanographic and Atmospheric Administration (NOAA) and a population database provided by the National Aeronautics and Space Administration (NASA). The simulations ingested meteorological data from the Global Data Assimilation System (GDAS) and were conducted as if the radiation release and spread happened in the third and fourth weeks of March 2021.[6]
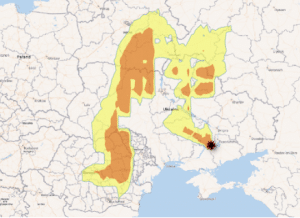
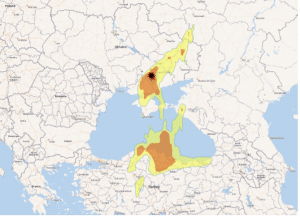
On the maps in Figure 1 below, the contamination levels for compulsory evacuation are shown in orange and those for voluntary evacuation in yellow. The yellow area corresponds to contamination levels greater than 0.5 megabecquerels per square meter and less than 1.5 megabecquerels per square meter. The orange area corresponds to contamination levels greater than 1.5 megabecquerels per square meter. As shown in the maps, populations could have to be relocated in up to five countries, depending on the the type of nuclear incident and weather patterns.
After the Chernobyl accident, in addition to the 30-kilometer-radius evacuation zone around the reactor, relocation was made compulsory from areas with cesium 137 contamination levels higher than about 1.5 megabecquerels per square meter. Below this contamination level, strict radiation-dose-control measures were imposed in areas contaminated down to 0.5 megabecquerels per square meter. Nevertheless, large fractions of the populations in those “radiation-control” areas evacuated. In Ukraine, evacuation of these areas was made compulsory.[7] In addition to an initial 20-kilometer evacuation zone, a standard similar to 1.5 megabecquerels per square meter was used for Fukushima.[8]
Figure 1: Estimated contamination levels for hypothetical nuclear accidents at Zaporizhzhya 1 in the third and fourth week of March 2021.

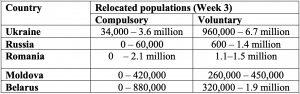
Tables 1 and 2 below show the populations corresponding to the relocation areas in Ukraine and the neighboring countries for the hypothetical nuclear accidents calculated for two weather patterns in March.
Table 1: Relocated populations for hypothetical nuclear accident at Zaporozhye 1
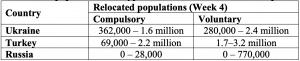
Table 2: Relocated populations for hypothetical nuclear accident at Zaporozhye 1
Notes
[1] “Updated information about Zaporizhzhia NPP,” 04 March 2022 07:15, https://snriu.gov.ua/en/news/updated-information-about-zaporizhzhia-npp.
[2] “Nuclear Power in Ukraine,” World Nuclear Association, Updated 4 March 2022, https://world-nuclear.org/information-library/country-profiles/countries-t-z/ukraine.aspx.
[3] A core inventory of cesium 137 is estimated from those of Fukushima Unit 1, 2 and 3. K. Nishihara, H. Iwamoto, and K. Suyama, “Estimation of Fuel Compositions in Fukushima-Daiichi Nuclear Power Plant,” JAEA, JAEA-Data/Code 2012-018 (Japanese), https://jopss.jaea.go.jp/pdfdata/JAEA-Data-Code-2012-018.pdf; A 50% release rate is based on Table 4 of a report. M.L. Ang et al., “A Comparison of World-wide Uses of Severe Reactor Accident Source Terms,” SAND94-2157, September 1994, https://inis.iaea.org/collection/NCLCollectionStore/_Public/26/032/26032994.pdf; The amount of 157 petabecquerels of radioactivity of cesium 137 is about twice of that from the Chernobyl accident which was about 85 petabecquerels. UN Scientific Committee on the Effects of Atomic Radiation, UNSCEAR 2000: Summary of Low-Dose Radiation Effects on Health (New York: United Nations, 2000), Annex J, https://www.unscear.org/docs/publications/2000/UNSCEAR_2000_Annex-J.pdf.
[4] A 75 percent release of cesium 137 that is originally contained in the spent fuel pool is US NRC’s assumption for the densely packed spent fuel pool fire. “Generic Environmental Impact Statement for Continued Storage of Spent Nuclear Fuel,” NUREG-2157 Vol.1, USNRC, 2013, https://www.nrc.gov/docs/ML1419/ML14196A105.pdf; We estimate 186 tHM, as the current spent fuel inventory of re-racked pool of Zaporizhzhya 1. A. Afanasyev, “Spent Fuel Management in the Ukraine,” 1998, https://inis.iaea.org/collection/NCLCollectionStore/_Public/29/026/29026647.pdf?r=1; An inventory of spent fuel of ZNPP 1 as of 1 July 2017 was 141 tHM. National Report of Ukraine for the 6th Review Meeting, 2017, p.118, https://www.iaea.org/sites/default/files/national_report_of_ukraine_for_the_6th_review_meeting_-_english.pdf; We assume the average burnup of the spent fuel, 40 MWd/kgHM. The amount of 590 PBq of radioactivity of Cs-137 is about seven times of that from the Chernobyl accident which was about 85 PBq.
[5] A.F. Stein, et al., “NOAA’s HYSPLIT atmospheric transport and dispersion modeling system,” Bull. Amer. Meteor. Soc., 96, 2059-2077, 2015, http://dx.doi.org/10.1175/BAMS-D-14-00110.1.
[6] The meteorological data used involved a three-hour time resolution and one-degree spatial resolution. The model was employed to simulate a 32-hour long release and the subsequent dispersion for one week, including dry and wet deposition.
[7] Frank von Hippel, Masafumi Takubo, Jungmin Kang, “Plutonium: How Nuclear Power’s Dream Fuel Became a Nightmare,” Springer 2019. After the Chernobyl accident, the threshold contamination levels for compulsory evacuation and for strict radiation control were set at 40 curies per square kilometer (1.48 megabecquerels per square meter), and 15 curies per square kilometer (0.56 megabecquerels per square meter), respectively. UN Scientific Committee on the Effects of Atomic Radiation, UNSCEAR 2000 Report to the General Assembly, with Scientific Annexes: Sources and Effects of Ionizing Radiation, Vol. 2, Annex J, “Exposures and Effects of the Chernobyl Accident” (New York: United Nations, 2000), http://www.unscear.org/docs/publications/2000/UNSCEAR_2000_Annex-J.pdf.
[8] Frank von Hippel, Masafumi Takubo, Jungmin Kang, “Plutonium: How Nuclear Power’s Dream Fuel Became a Nightmare,” Springer 2019. At Fukushima, the Japanese government set the threshold for compulsory evacuation at an unshielded dose rate of 20 millisieverts in the first year, which, after taking into account weathering effects, corresponds to about 1.5 megabecquerels per square meter. Frank N. von Hippel and Michael Schoeppner, “Economic Losses from a Fire in a Dense-Packed U.S. Spent Fuel Pool,” Science & Global Security, 25 (2017): 80-92, endnote 10, https://doi.org/10.1080/08929882.2017.1318561.
Together, we make the world safer.
The Bulletin elevates expert voices above the noise. But as an independent nonprofit organization, our operations depend on the support of readers like you. Help us continue to deliver quality journalism that holds leaders accountable. Your support of our work at any level is important. In return, we promise our coverage will be understandable, influential, vigilant, solution-oriented, and fair-minded. Together we can make a difference.
Get alerts about this thread
0 Comments
Oldest

Jungmin Kang
Jungmin Kang is a part-time visiting researcher at the School of Public Policy and Global Affairs, University of British Columbia. Kang is also South... Read More

Eva Lisowski
Eva Lisowski is a member of the MIT Nuclear Weapons Education Project and an independent consultant in nuclear weapons effects modeling and nuclear... Read More