Figuring out the most realistic projections for sea-level rise: Interview with glaciologist Rob DeConto
By Dan Drollette Jr | July 15, 2024
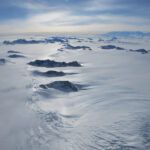
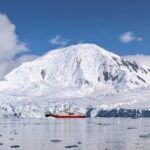
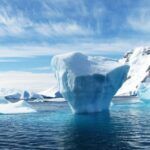
A NASA P-3 airborne laboratory plane casts a shadow on the calving front of Jakobshavn Glacier in Greenland, during a 2014 “Operation Ice Bridge” survey flight to study the Earth’s polar ice. Public domain image courtesy NASA / Jim Yungel via Wikimedia Commons. www.nasa.gov/icebridge
Figuring out the most realistic projections for sea-level rise: Interview with glaciologist Rob DeConto
By Dan Drollette Jr | July 15, 2024
Rob DeConto and his research group of postdocs and grad students study polar climate change, the role of glaciers and ice sheets in past and future sea-level change, and the impacts of sea-level rise on coastlines and people. His research on ice sheets and sea-level rise has been highlighted on the cover of Nature, the front page of the New York Times, and PBS NOVA. DeConto is a professor of Earth and climate sciences at the University of Massachusetts-Amherst, a fellow of the American Geophysical Union, and a selected lead author of the Intergovernmental Panel on Climate Change. He serves on a number of national and international science boards and he is a recipient of the Tinker-Muse Prize for Science and Policy in Antarctica.
In this interview, DeConto delves into some of the latest findings about ice break-up and melting, the nature of computer modeling and probability, and why there is “deep uncertainty” about predictions for sea-level rise by the end of this century. He explains why the phrase “low-likelihood” may be a misnomer when it comes to so-called “low-likelihood, high-impact” projections.
(Editor’s note: This interview has been condensed and edited for brevity and clarity.)
Dan Drollette Jr: I understand your research is based in both Antarctica and Greenland. How do the two compare? What have you been finding?
DeConto: I’ve been particularly interested in Antarctica because it poses some really interesting questions in terms of what we might expect in a warmer world. So much of the ice sheet there is resting on bedrock that’s way below sea level.
That’s unlike Greenland, which is a really different kind of animal. Most of the Greenland ice sheet is resting on bedrock, above sea level. That means that the edges of the Greenland ice sheet are mostly resting on land, while in Antarctica, the edge of the ice sheet is flowing right into the ocean.
That difference makes the Antarctic system a real challenge to understand how it might behave in a warmer world where both the atmosphere and the ocean are warming—the Antarctic is interacting with the ocean as well as feeling the changes from a warming atmosphere.
Drollette: In a previous Bulletin interview, a geologist with the British Antarctic Survey at Antarctica’s Thwaites Glacier talked a lot about the incredible, high-tech effort to figure out exactly what’s happening at that spot where the ice is resting on the bank.[1]
DeConto: Exactly. We call that the grounding line.
Drollette: What’s happening to it?
DeConto: Well, that’s the point where the ice flows toward the ocean—the ice is just beginning to lift off the bed to float in some places.
What we’re seeing is that what’s left of the floating extension of the ice sheet has been thinning and melting. And the grounding line itself has been retreating landward, just as quickly. As it retreats landward, the bedrock actually slopes down, away from the ocean, toward the interior of the continent. So as the grounding line retreats, it’s retreating onto deeper and deeper bedrock.
Meanwhile, the thickness of the ice at that grounding line is getting taller and taller as it retreats backwards into the interior of the ice sheet.
Now, there have been some theoretical, analytical, and numerical computer models of it, and they all converge on the notion that as the grounding line retreats onto that reverse slope bedrock, more and more ice will flow into the ocean, sort of initiating a positive feedback—what has been termed “marine ice sheet instability.” (See Figure 1 below.)
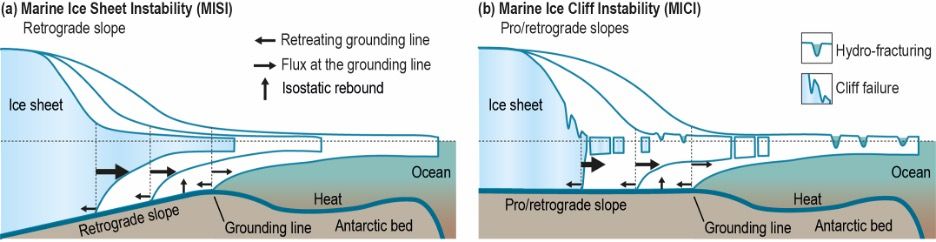
In panel “a,” thinning of the buttressing ice shelf leads to acceleration of the ice sheet flow and thinning of the marine-terminated ice margin. Because bedrock under the ice sheet is sloping towards ice sheet interior, thinning of the ice causes retreat of the grounding line followed by an increase of the seaward ice flux, further thinning of the ice margin, and further retreat of the grounding line.
In panel “b,” disintegration of the ice shelf due to bottom melting and hydro-fracturing produces an ice cliff. If the cliff is tall enough (at least about 800 meters of total ice thickness, or about 100 meters of ice above the water line), the stresses at the cliff face exceed the strength of the ice, and the cliff fails structurally in repeated calving events.
Image courtesy of IPCC Special Report on the Ocean and Cryosphere in a Changing Climate, “Summary for Policymakers” https://www.ipcc.ch/srocc
That instability has long been thought of as having the potential to be a really dangerous result of a warming climate—this positive feedback would be initiated at places like the Thwaites Glacier, potentially leading to the collapse of the West Antarctic Ice Sheet and a lot of sea-level rise.
So a lot of work has been focused on trying to understand those processes to determine whether or not there really is an instability—and whether or not it’s reversible. So those are some of the fundamental dynamics that people who study the Antarctic ice sheet are working on.
Drollette: In the popular press, I’ve seen the Thwaites referred to as the “Doomsday Glacier.”[2]
DeConto: Yes, I’ve seen similar characterizations in the media. You know, when you get back up into the far reaches of the Thwaites Glacier, it’s more than two kilometers [about 1.24 miles] below sea level in places. Which is why there’s concern.
Drollette: How much sea-level rise are you talking—is it closer to 3 feet of sea-level rise by the year 2100 or 30 feet? And on what kind of timescale?
DeConto: Hmmm. Well, you know, the whole ice sheet itself contains enough ice to raise sea level by about 58 meters [190 feet]—that’s how much ice is locked up on the continent. So even small changes around the fringes of the ice-sheet will have serious consequences for coastlines around the world.
As to the second part of your question, timescale is what we’re all after. There are geologists who study ancient sea-level rise, and they’ve found that at least two times in the recent geologic past—such as the last interglacial period about 125,000 years ago—the global average climate was pretty close to what it is like today. And during those times, the sea level was in the range of like five to nine meters [about 16.4 to 29.5 feet] higher than today. So we know that just a little bit of warming can drive big changes in the ice sheets.
But at this point, geologists can’t provide very precise information regarding how long that took. So that’s what I and my team are trying to do: Develop and use computer models to try to say something about the rate.
Drollette: So the key thing is really the rate of sea level rise?
DeConto: Yes—and all the models say something different, depending on what processes are included.
For example, one of the really big uncertainties about the rate at which things are melting is related not so much to the way that ice flows as to the brittle processes of ice. As we all know, if ice is put under enough stress, it can break, as you can easily see in those dramatic images of big icebergs being formed. But there’s a great deal of uncertainty about the brittle processes themselves—the actual breaking that makes icebergs—and whether or not they can substantially add to the rate of sea-level rise in the future. And so I’ve been involved in a series of what turns out to be controversial papers, trying to say something about how those brittle mechanical processes, the breaking of the ice, might basically make a retreat of the West Antarctic Ice Sheet occur much faster—evolving from maybe millennial timescales to being more of a decades-to-century sort of time frame. And I don’t have any clear answers for you.
We’ve all been trying to make projections of what future sea-level might be like, but only a few models so far have attempted to try to add these mechanical processes about icebergs. My hunch is that when you do include those processes, it increases the pace of ice loss—it doesn’t slow ice loss down.
Drollette: And at the same time, it appears that there are other things going on that people weren’t aware of. I’m thinking of an article being written for us by one of your colleagues at the British Antarctic Survey, Michael Meredith, on the discovery of what he calls “underwater tsunamis.”[3]
DeConto: There have been a lot of really dramatic, interesting findings happening in the last few years down there.
You’ve probably heard about how the Antarctic sea ice has been at an all-time minimum in our observations. Now, that’s obviously making life really tough on the penguins who are trying to hatch and feed their young there. But it’s also potentially going to have an impact on the ice sheet itself, for lots of different reasons.
For example, the ice provides some support for the ice shelves, which in turn slows down the flow of the main ice sheet—that big pile of ice deforming under its own weight and flowing out toward the ocean. These ice shelves—and by that I mean the floating part of the glacier that’s seaward of the grounding line, where the ice is thin enough to begin to float—act as floating extensions of the ice sheet itself, where they play the most important role of all in terms of what’s going to happen to Antarctica in the future. Because they do two things: They both slow the flow of the ice sheet toward the ocean, and at the same time they also provide structural support that inhibits the breaking-up of the really thick ice at the edge of the ice sheet.
And we’re observing many of the ice shelves around the Antarctic margin are thinning today, they’re being attacked by warm ocean waters from below, and by warm summertime temperatures in the air above.
Drollette: What do those warm air temperatures do?
DeConto: When the atmospheric temperatures start going above freezing in the summertime, they begin to produce a lot of meltwater on the surface of these ice shelves. And there’s concern that a lot of meltwater can also attack these ice shelves and make them break up—because the water is heavy, and as it moves it produces flexural stresses on the shelves, getting into cracks and wedging them open.
Bottom line: These ice shelves have the potential to be eroded both from the ocean from the bottom up, and from above by having warm air temperatures on the surface making meltwater on their surfaces.
Drollette: Why is that important?
DeConto: If these processes cause the ice shelves to then break up, then now we’re exposing the ice sheet itself—where the ice is really thick—without that nice structural support. And so regardless of whether it’s just faster flow, or the breaking and making of lots of icebergs, they both lead to increased rates of ice loss.
Drollette: Is it reversible? Or is this a one-way process? I know that researchers are still trying to nail this down for sure, but what’s your gut feeling?
DeConto: Well, that’s the big question.
There have been a couple of papers published just in the last few years that have shown that even in the Thwaites Glacier region, the grounding line can still recover—assuming that temperatures were to ever go back to the way they were in pre-industrial times.
But multiple modeling studies, including my own, have demonstrated that it’s a one-way street if we just look at today’s climate, atmospheric air temperatures, and current ocean temperatures under the ice shelves. If they persist at those levels—meaning that the world didn’t get any warmer, which is a long shot—then we can expect to see ongoing contributions to sea-level rise from Antarctica.
And that’s an optimistic scenario; eventually that Thwaites Glacier grounding line is going to be retreating into that thicker and thicker ice. And as it does, the rate of sea-level rise is expected to increase. Now, every modeling study is different, but my work suggests that even just with today’s climate—not including a lot of additional global warming on top of what we already have—after roughly 100 years or so, the grounding lines in places around Antarctica will have moved back into places thick enough that there’s going to start to be a significant uptick in the rate of sea-level rise.
And once the grounding lines get into really deep bedrock, then it becomes harder and harder for the system to be reversible, because those ice shelves are so critical. They could really only re-form if the planet were to return to some state that is much colder than today.
That would hint that it could be millennia, almost like we’d have to have another Ice Age before the ice sheet recovers.
So, Greenland and Antarctica today are contributing to sea-level rise: Greenland about twice the contribution relative to Antarctica, but they’re both contributing. And they’re both accelerating in terms of the pace of ice loss.
And every inch of land that we lose to sea-level rise from the loss to Greenland and Antarctic ice sheets is essentially permanent.
Drollette: Do you want to hazard a guess as to what kind of numbers we’re talking by the year 2100? Is it a 30-foot rise in sea-level?
DeConto: I think the best way to get a feeling for that is in this chart from the most recent IPCC [Intergovernmental Panel on Climate Change] assessment that compiles all of the recent modeling work.[4] What’s really nice is that they provide the projections in a probabilistic framework—such as what’s the best guess at the 50th percentile versus maybe having a band of uncertainty around that best estimate. (See Figure 2 below.)
These brittle, icy processes that we just talked about are the big unknown, which Richard Alley,[5] myself, and others have been really passionately investigating, as they could be a really important uncertainty. And you’ll see that there’s a huge range of projections, from a few centimeters at the end of this century, versus my own work published in Nature a couple of years ago.[6] My work shows that if these brittle, icy processes did indeed begin to kick in and begin to play a role, then we would be talking about something more on the order of 30 centimeters [just under one foot] of sea-level rise from the Antarctic ice sheet alone.
That huge range of uncertainty, you know, points to the critical need to do more work. And to figure this out.
We have a much better handle on the upper boundaries of what Greenland’s potential is, because the processes in Greenland are nearly entirely related to surface melt caused by just summer air temperatures.
In contrast, in Antarctica, we’ve got this interaction with the ocean I’ve been talking about. That produces a huge amount of uncertainty. In fact, the IPCC uses the term “deep uncertainty” to describe the situation with regards to the Antarctic contribution to sea level and provides a specific definition.
Drollette: So, when you’re talking about the 30-centimeter figure from Antarctica alone, that’s 30 centimeters by the year 2100?
DeConto: Yeah, that’s the ballpark by 2100, but it’s certainly not the limit on what’s physically possible. Those numbers are much, much higher—again, due to this great uncertainty about how fast the ice might actually begin to break up, if the grounding lines begin to retreat back into thicker and thicker ice.
Drollette: So if we were talking 30 centimeters from Antarctica, and you were saying earlier that Greenland gives about twice the contribution—or 60 centimeters—then that gives a total of 90 centimeters. So you’re talking close to a meter, or roughly about 3 feet of sea-level rise, likely by 2100.
DeConto: And again, that’s with deep, deep uncertainty. There might be these processes being set off that are irreversible, so that’s the very low end of the spectrum.
Drollette: It seems that every time I read in the press of an IPCC result, it’s always these very conservative figures; science loves to be as conservative as possible. But maybe there’s such as thing as being too cautious and conservative in projections of climate change—and the way that those projections are reported.
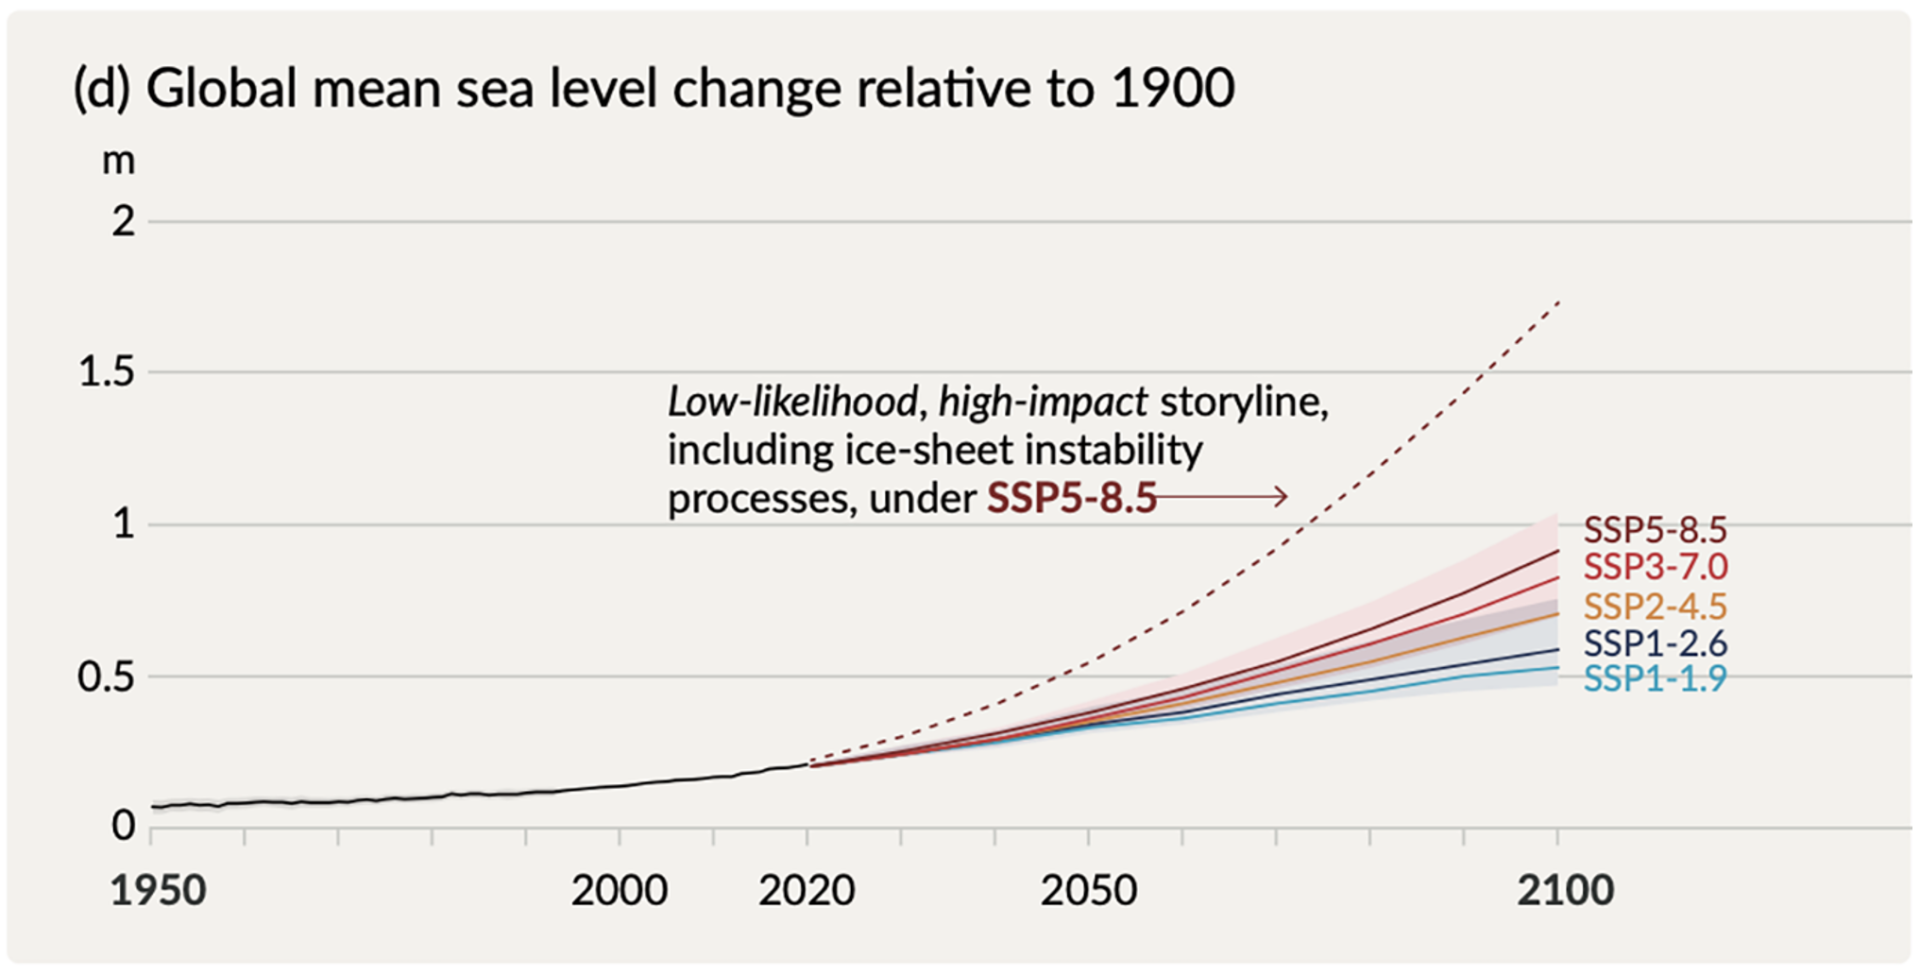
From panel (d) of page 22, Figure SPM.8, “Selected indicators of global climate change under the five illustrative scenarios used in this Report,” Special Report on the Ocean and Cryosphere in a Changing Climate, “Summary for Policymakers.” https://www.ipcc.ch/srocc/ Image courtesy of IPCC
DeConto: This is what I’ve been talking about, from page 22, panel D of the summary for policymakers of the latest IPCC report. This is the real money document, intended to be understandable to an informed but still lay audience, though sometimes the figures can still be a little bit meaty. (See figure 2 above)
So this is the most recent IPCC take on sea-level rise, with projections out to 2100. Each one of these colored lines is representative of a different emission scenario. And there’s a colored range that matches the line around the solid line. So the solid line is the best estimate; it’s the 50th percentile of variability either way. Around that central estimate—the so-called “likely range”—is the 17th to the 83rd percentile of a distribution of possibilities. In other words, if we look at the highest emission scenario—this dark red line—the top of that shading is the 83rd percentile of that distribution, which means that there is still a 17-percent chance that there could be a higher outcome.
I would go so far as to say, if there was a 17-percent chance that the airplane you were getting on wasn’t going to make it to its destination, you’d be thinking twice about getting on that plane.
Analyzing this further, this dashed line is what the team responsible for writing this section of the report called a “low likelihood / high impact storyline.” It’s basically replacing the Antarctic and Greenland future ice sheet projections with just two pieces of information. And because there were just two papers that the dashed line hinges on, it was not deemed to have sufficient reliability—the confidence level is low because there are only two papers that the dashed line stems from. One of those papers is from my work on Antarctica. And the second paper was actually a paper where projections of future Antarctic and Greenland ice loss were based on expert judgment.
So, using expert solicited input, that was statistically calibrated and done with a lot of statistical rigor, but based on structured expert judgment. And when they took my Antarctic results from a numerical model that include or attempt to include crudely these calving processes, and then the expert judgment, you end up with this dashed red line.
Now, what I have always been a little bit uneasy about in terms of the messaging is the use of the phrase “low likelihood.” Because what I find often with people who have to make policy decisions is that sometimes folks read that term and assume that we know that the likelihood is low, as indicated by the dashed line. When in fact, the real point is that we don’t know the likelihood, we don’t know the probability distribution function that includes these processes.
Regardless of the nuances of the messaging, I’m still really happy that the dashed line got into the summary for policy makers, because it clearly shows that there could be outcomes in their projections that are way outside of the so called “likely range.”
And don’t forget that this dashed line is not the limit of what’s physically possible, it’s the 83rd percentile of the high-emission scenario. If we were looking at my model results at something like, let’s say, the 90th percentile, it would be something even higher—much, much higher—pushing sea level out well above a meter by the end of the century.
And if we look on even a longer time scale, there’s some very powerful language here that says that sea-level rise greater than 15 meters [about 49 feet] cannot be ruled out, over the course of, say, three centuries, or the year 2300.
And again, this is that dashed red line representing processes that could become really important in the future, but which we still don’t have sufficient understanding of. But there could be an outcome that is far greater than just the standard likely range as deemed by the IPCC approach to compiling all the papers and all the modeling that had been done in advance of publication of the assessment.
Drollette: Interpreting for a lay audience what “likely range,” “possibility,” “probability,” and “confidence level” mean in a research paper is always tricky in the world of science journalism. Because physicists don’t like to say the word “never”—it’s too absolute. If you remember the Oppenheimer movie, there was a scene where the title character says that the chance of pushing the button on the atom bomb and destroying the world were “near-zero.”
DeConto: And sometimes people will say “it can’t be ruled out” as another way of expressing that sort of deep uncertainty. It is a tricky topic. There actually has been a little bit of literature on this particular case in Earth’s Future, published by Roderik van de Wal in the last year or two.[7] It tries to provide some context for what is possible at the high end for sea level, and it gets into those issues.
Drollette: This must make it difficult when policy makers ask you what to expect for the future of things like the Overseas Highway in the Florida Keys.
DeConto: Well, I can talk about what we do know—which is that we do have a pretty good handle on quite accurately measuring the rate of sea-level rise today, and the changes in the rate.
You know, if you look out sort of to the middle of this century, that sort of timescale, then there’s very little difference between the greenhouse gas emission scenarios in terms of sea level rise relative to the year 2000. In rough ballpark numbers—because it’s different every place you look around the world, because sea level rise doesn’t change by the same amount, everywhere—we’ve got to be planning for a least of foot of sea-level rise by 2050
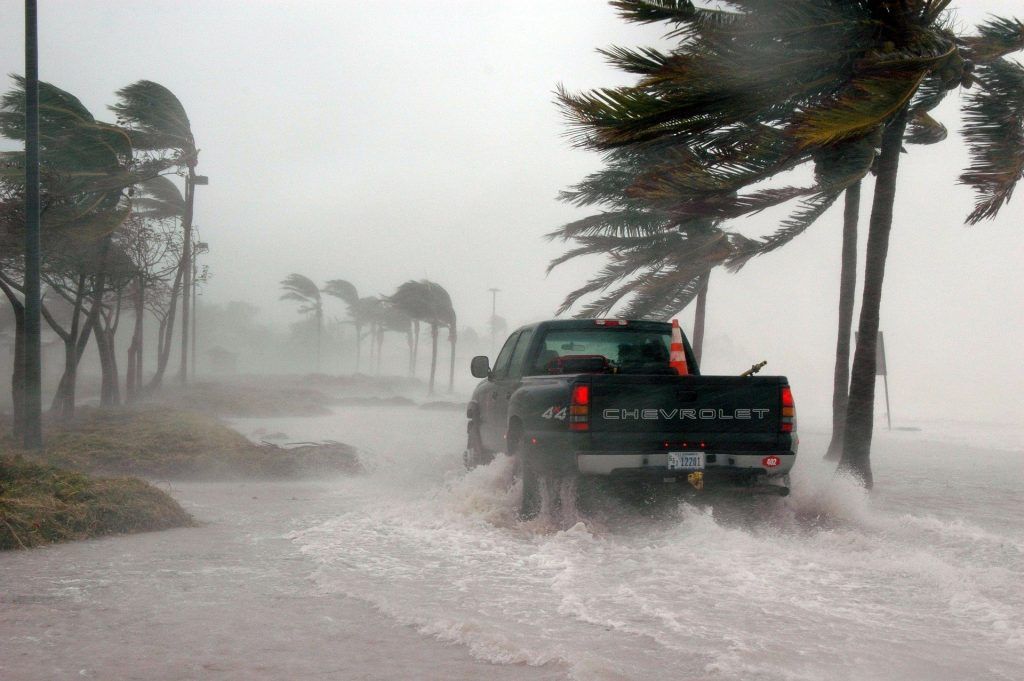
And that’s significant: A foot of sea-level rise does a lot of damage in places that are already close to the sea level. That would be an exponential increase in the number of king tide or high tide flooding events in places like downtown Boston or Norfolk, Virginia. You’re so much more susceptible to storm surges if there happens to be another Hurricane Sandy.
So, we have solid knowledge about what’s coming in the near-ish future; it’s time maybe to start think creatively about adaptive engineering, in case there are really rapid rates of sea level rise.
I think people get really hung up on a level of one meter in the year 2100 or 2125. I often stress it’s the rate of sea-level rise that you’re responding to, as much as the absolute figure.
Drollette: It’s kind of a depressing prospect, but it sounds like what you’re saying is that even if we could keep the planet’s heating to 1.5 degrees Celsius (1.8 degrees Fahrenheit)—which it looks like we’re going to barrel past—that wouldn’t have been enough to stop the glaciers from melting and the seas from rising.
DeConto: Yes, melting and sea-level rise is happening now with today’s climate, which is at roughly about 1.1 Celsius. Now, that’s bad enough, but what we don’t want to start treading on is the possibility of really destroying those ice shelves—basically taking the cork out of the bottle, and letting the ice just flow into the ocean with a dramatic uptick in the pace.
You hit the nail on the head, we’re going to have challenges around our global coastlines from sea-level rise, even at 1.5 Celsius. We just don’t know how much more we can keep pushing the system with more warming before we really start to see a dramatic uptick, with the big Antarctic ice sheet beginning to flow faster into the ocean.
In that Nature paper I spoke of, there’s some language about some of these controversial processes that we included in our modeling. We did our best to explore what it mean if we can keep things to 1.5 Celsius, if we can keep things to 2 Celsius—just kind of trying to get a feeling for where the threshold might lie. Of course, there’s a ton of uncertainty, but it was interesting to see that once you added a little bit above 2 Celsius to the model, there’s essentially a whole order of magnitude uptick in the pace of Antarctic ice loss starting by about 2070 in the model. Again, there’s a huge amount of uncertainty associated with these magnitudes and the timing. But it goes to show how much we want to avoid that, and at least try to keep the temperature somewhat close to what it is today—even if it is already too warm. That is really the best chance we have of not triggering these sorts of processes that would lead to just massive coastal abandonment.
Drollette: So the idea is to keep it somewhat close to tolerable.
DeConto: You know, I’ve had several discussions about this. We’ve published some articles, trying to get across the concept that there’s nothing magical about 1.5 Celsius, it’s not all-or-nothing—as if 1.49 is fine, but at 1.5 all the world’s gone to hell. It’s not like that.
Drollette: What do you think of some of the technocratic ideas to bring those temperatures down?
DeConto: Solar radiation management terrifies me to death. In the cryosphere community—my community—we are very much grappling with some ideas that had been raised with the potential for serious financial backing that are just completely insane. They would be enormously energetic themselves to try to undertake—and they’re not feasible, they won’t work. To me, they’re just a distraction.
Drollette: What are some of these ideas?
DeConto: As regards the flow of the Antarctic ice sheet, there have been ideas to try to drill through the places where the glaciers are flowing fast, and then pumping the water away from the ice/rock interface. That would theoretically make the ice stickier, so it slows down the flow.
They’re talking about putting a submarine curtain in front of a big stretch of the Antarctic margin to keep warm ocean waters from getting under these ice shelves.
And in the Arctic, one idea is to launch armies of underwater drones basically to poke holes through the sea ice and pump saltwater onto the surface to thicken it, so it lasts longer into the summer—never mind that Arctic sea ice is mainly made of freshwater and now you’d be putting saltwater on the surface.
It’s all just lunacy to me, a serious distraction from what we should be aiming toward doing now, which is to stop burning fossil fuel.
Incidentally, in that Nature paper I mentioned, we actually looked a little bit at how long you could wait before geoengineering carbon dioxide. Like if we had like clean air capture technology all of a sudden, where we’re able to actually suck carbon dioxide back out of the atmosphere, how long we could wait before the big uptick in the rate of sea-level rise becomes irreversible. And we found that once it’s started, marine-based ice loss is unstoppable on a timescale of use, even with carbon-dioxide removal technology.
Drollette: Imagine that you were to find yourself in an elevator with the President of the United States, and you had 30 seconds to explain to him what you found. What would you say?
DeConto: I know that the scale of the problem is hard to get your head around—even having worked on the ice sheet and seen these melting processes up close. But even tiny changes in these vast systems are going to have huge consequences for society, for ecosystems, and for the remotest places.
We have deep uncertainty about how these systems are going to respond—and within just a few decades, we start to get into really head-scratching territory. What’s going to happen to these systems? And if they did all go in one direction, it could have just absolutely world-changing consequences: The coastlines would look almost unrecognizable from a satellite viewing the planet.
Given the magnitude of the threat, and actually observing an acceleration in the rate of change over the last few years, it’s obvious that we really need all hands on deck. The melting of these ice sheets pose an existential threat to nearly all of our infrastructure on the planet. I think it’s as simple as that.
Endnotes
[1] For more, see May 1, 2020 Bulletin interview, “Peter Davis of the British Antarctic Survey on changes in the Thwaites Glacier,” https://thebulletin.org/premium/2020-05/peter-davis-of-the-british-antarctic-survey-on-changes-in-the-thwaites-glacier/
[2] See “The Doomsday Glacier” by Jeff Goodell in May 9, 2017 Rolling Stone https://www.rollingstone.com/politics/politics-features/the-doomsday-glacier-113792/
[3] For more, see “When glaciers calve: Huge underwater tsunamis found at edge of Antarctica, likely affecting ice melt” by Michael Meredith in the July 2024 issue of the Bulletin of the Atomic Scientists.
[4] To download a PDF of the relevant part of the IPCC report where the chart appears, see “Summary for Policymakers” at https://www.ipcc.ch/report/ar6/wg1/downloads/report/IPCC_AR6_WGI_SPM.pdf and go to page 22.
[5] Richard Alley is a professor of geoscience at the Penn State Ice and Climate Exploration group who has been studying the great ice sheets of Antarctica and Greenland—as well as mountain glaciers—to learn how the ice will change in the future and affect sea level. More can be found at https://www.ems.psu.edu/profile/faculty/richard-alley
[6] See “The Paris Climate Agreement and future sea-level rise from Antarctica” by DeConto et al in May 4, 2021 issue of Nature at https://www.nature.com/articles/s41586-021-03427-0
[7] The October 2022 article “A High-End Estimate of Sea Level Rise for Practitioners” by Roderik van de Wal can be found at the American Geophysical Union’s Earth’s Future magazine at https://agupubs.onlinelibrary.wiley.com/doi/pdfdirect/10.1029/2022EF002751
Together, we make the world safer.
The Bulletin elevates expert voices above the noise. But as an independent nonprofit organization, our operations depend on the support of readers like you. Help us continue to deliver quality journalism that holds leaders accountable. Your support of our work at any level is important. In return, we promise our coverage will be understandable, influential, vigilant, solution-oriented, and fair-minded. Together we can make a difference.
Keywords: Antarctica, climate crisis, global warming, ice shelves, melting, sea level rise
Topics: Climate Change, Special Topics
Get alerts about this thread
0 Comments
Oldest

Dan Drollette Jr
Dan Drollette Jr is the executive editor of the Bulletin of the Atomic Scientists. He is a science writer/editor and foreign correspondent... Read More
ALSO IN THIS ISSUE